Answer the question
In order to leave comments, you need to log in
How to build a pivot table in Excel?
It's not the first day I've been struggling with the problem of correctly building a report on resource congestion. The data is taken from the Project Server, based on which a pivot table (Figure 1) and a regular table (Figure 2) are formed. The problem is that you need to drag the columns "Number of hours per task per day" and "Capacity" into the rows of the pivot table, based on the date and resource name. 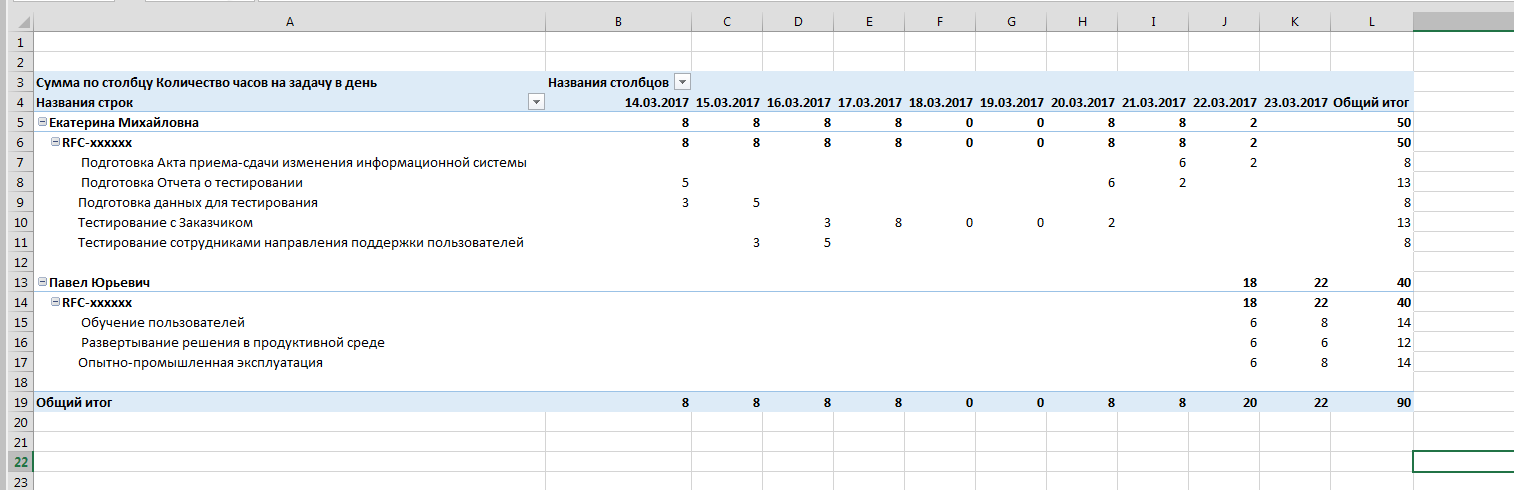
Figure 1 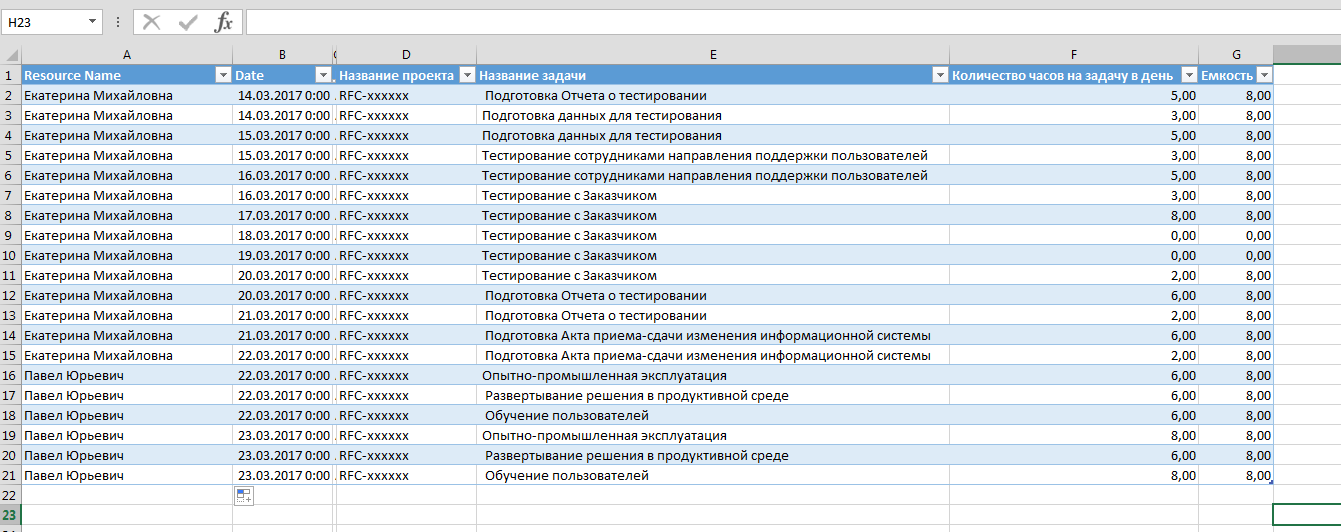
Figure 2 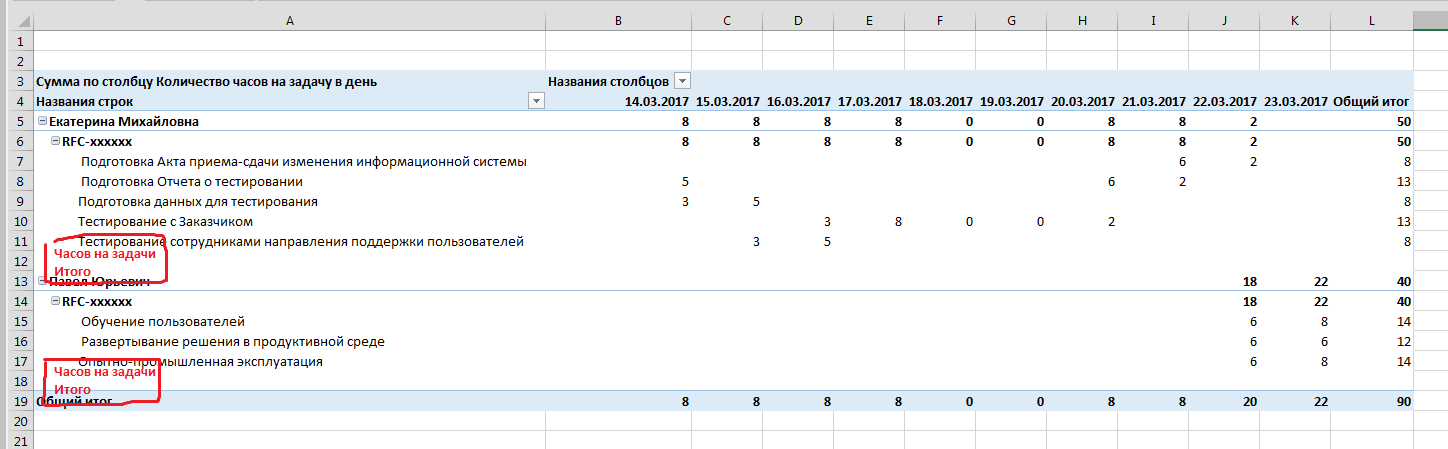
Figure 3
Answer the question
In order to leave comments, you need to log in
Didn't find what you were looking for?
Ask your questionAsk a Question
731 491 924 answers to any question