Answer the question
In order to leave comments, you need to log in
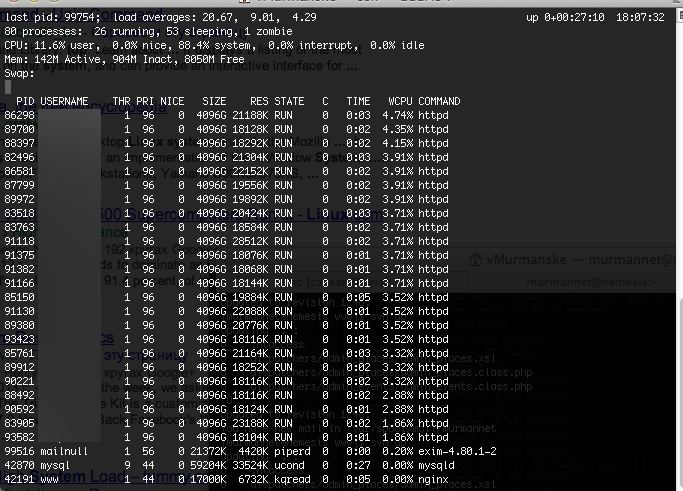
What do these top parameters say?
Hello, I have sites with low attendance (up to 1500). Unlim tariff on FirstVDS.
Sometimes everything starts to blunt, sites do not open. Their inadequate support responding at best the next day asks me to restrict access to search bots.
I look at the access logs and see that the bots do not go often and there is no “request attack”.
Given their experience, I suspect that this is some kind of load on the virtual node on their part. this already happened and I was transferred to another node, but now they turn on the fool.
Please see what this means. Only reboot helps.
Answer the question
In order to leave comments, you need to log in
Kill the bulky apache. I myself sat on it until a friend tested LOIC in LAN ... NGINX and everything will be fine, besides, there are a lot of modules now.
Perhaps they have problems with disks and your server suffers from this, because load average seems to hint at this (disks are one of the most reasons for high rates). But still, more statistics are needed to pinpoint the bottleneck
And how to extract smart disk information on a virtual server? Directly does not give, does not understand the type of disk.
It's hard to judge from the top.
If you want to see what exactly these Apache processes are doing, use mod_statys (http://httpd.apache.org/docs/2.2/mod/mod_status.html), be guided by pids
It is likely that neighboring nodes on wdsmaster... You can get more information about disk load using iostat / gstat
1 - Each Apache process consumes 4GB of virtual memory - this is very bad, and it is most likely consumed by some opCacher like xcache or apc or something like that, do not be too lazy to change the settings to more reasonable ones.
2 - A high system usage indicator indicates that the lion's share of CPU cycles is spent by the kernel (in your case it is 88.4%), therefore it can be any logic running in the kernel, be it a driver / packet filter / disk subsystem / network subsystem / etc.
If virtualization is used on the OpenVZ son, then a similar effect may well be observed due to the starvation of the host for the necessary resources, tk. if I'm not mistaken, in OpenVZ containers, CPU utilization is calculated by timestamps and is handled by the core of the container itself, therefore starving the host for CPU will cause the illusion that the container consumes a lot of CPU.
PS High LA indicates that the OS resource scheduler has a very large queue, make sure that the minute LA indicator is no more than the number of cores of available OS (valid only when the OS is running on hardware, without a hypervisor)
Didn't find what you were looking for?
Ask your questionAsk a Question
731 491 924 answers to any question