Answer the question
In order to leave comments, you need to log in
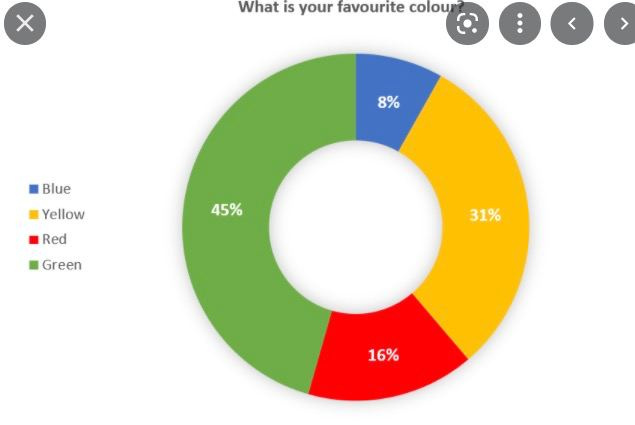
PIXI.JS: how to create a pie chart?
Good afternoon.
Maybe someone can throw off an example of how you can create a similar chart using pixi ?

Answer the question
In order to leave comments, you need to log in
You can get confused, draw a donut with arches:
How to Draw Text: Documentation .
This library is not about creating graphs. But if you want, then draw the figures with pens, paint over them, sign them.
https://pixijs.io/examples/#/graphics/simple.js
https://pixijs.io/examples/#/demos-advanced/spinners.js
https://pixijs.io/examples/#/interaction/ interacti...
Better use better libs
https://www.highcharts.com/demo#pie-charts
https://observablehq.com/@d3/gallery
Didn't find what you were looking for?
Ask your questionAsk a Question
731 491 924 answers to any question