Answer the question
In order to leave comments, you need to log in
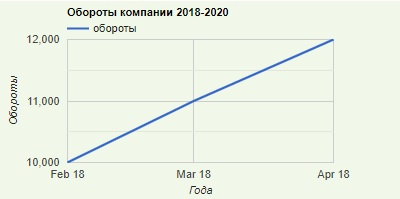
How to make months in Russian in Google Charts?
How to make months in Russian in Google Charts?
<html>
  <head>
   <script type="text/javascript" src="https://www.gstatic.com/charts/loader.js"></script>
  <script>
    google.charts.load('current', {packages: ['corechart', 'line']});
    google.charts.setOnLoadCallback(drawBackgroundColor);

    function drawBackgroundColor() {
        var data = new google.visualization.DataTable();
        data.addColumn('date', 'month');
        data.addColumn('number', 'обороты');

        data.addRows([
         [new Date(2018, 1, 1), 10000],
         [new Date(2018, 2, 1), 11000],
         [new Date(2018, 3, 1), 12000]
        ]);

      var options = {
        title: 'Обороты компании 2018-2020',
        hAxis: {
          title: 'Года',
          format: 'MMM YY'

        },
        vAxis: { title: 'Обороты' },
        backgroundColor: '#f1f8e9',
        legend: { position: 'top'},

        };

        var chart = new google.visualization.LineChart(document.getElementById('chart_div'));
        chart.draw(data, options);
      }

  </script>
  </head>
  <body>

    <div id="chart_div" style='width:fit-content'>
  </body>
</html>Answer the question
In order to leave comments, you need to log in
Didn't find what you were looking for?
Ask your questionAsk a Question
731 491 924 answers to any question