Answer the question
In order to leave comments, you need to log in
How to make a visualization of the zoning map of the Moscow region using GIS?
Hello. Tell me, please, who understands how to make a visualization of the zoning map of the Moscow region using GIS? For example, in QGIS, MapInfo and similar programs.
Answer the question
In order to leave comments, you need to log in
It is most correct that the data source contains the administrative boundaries of these regions. Secondly, the map must be vector (not from raster tiles). And when the polygons (these same areas) are known, you can configure their visual display, the level of the layer of administrative boundaries, etc.
Since you did not say how you get the data, there are no specific solutions.
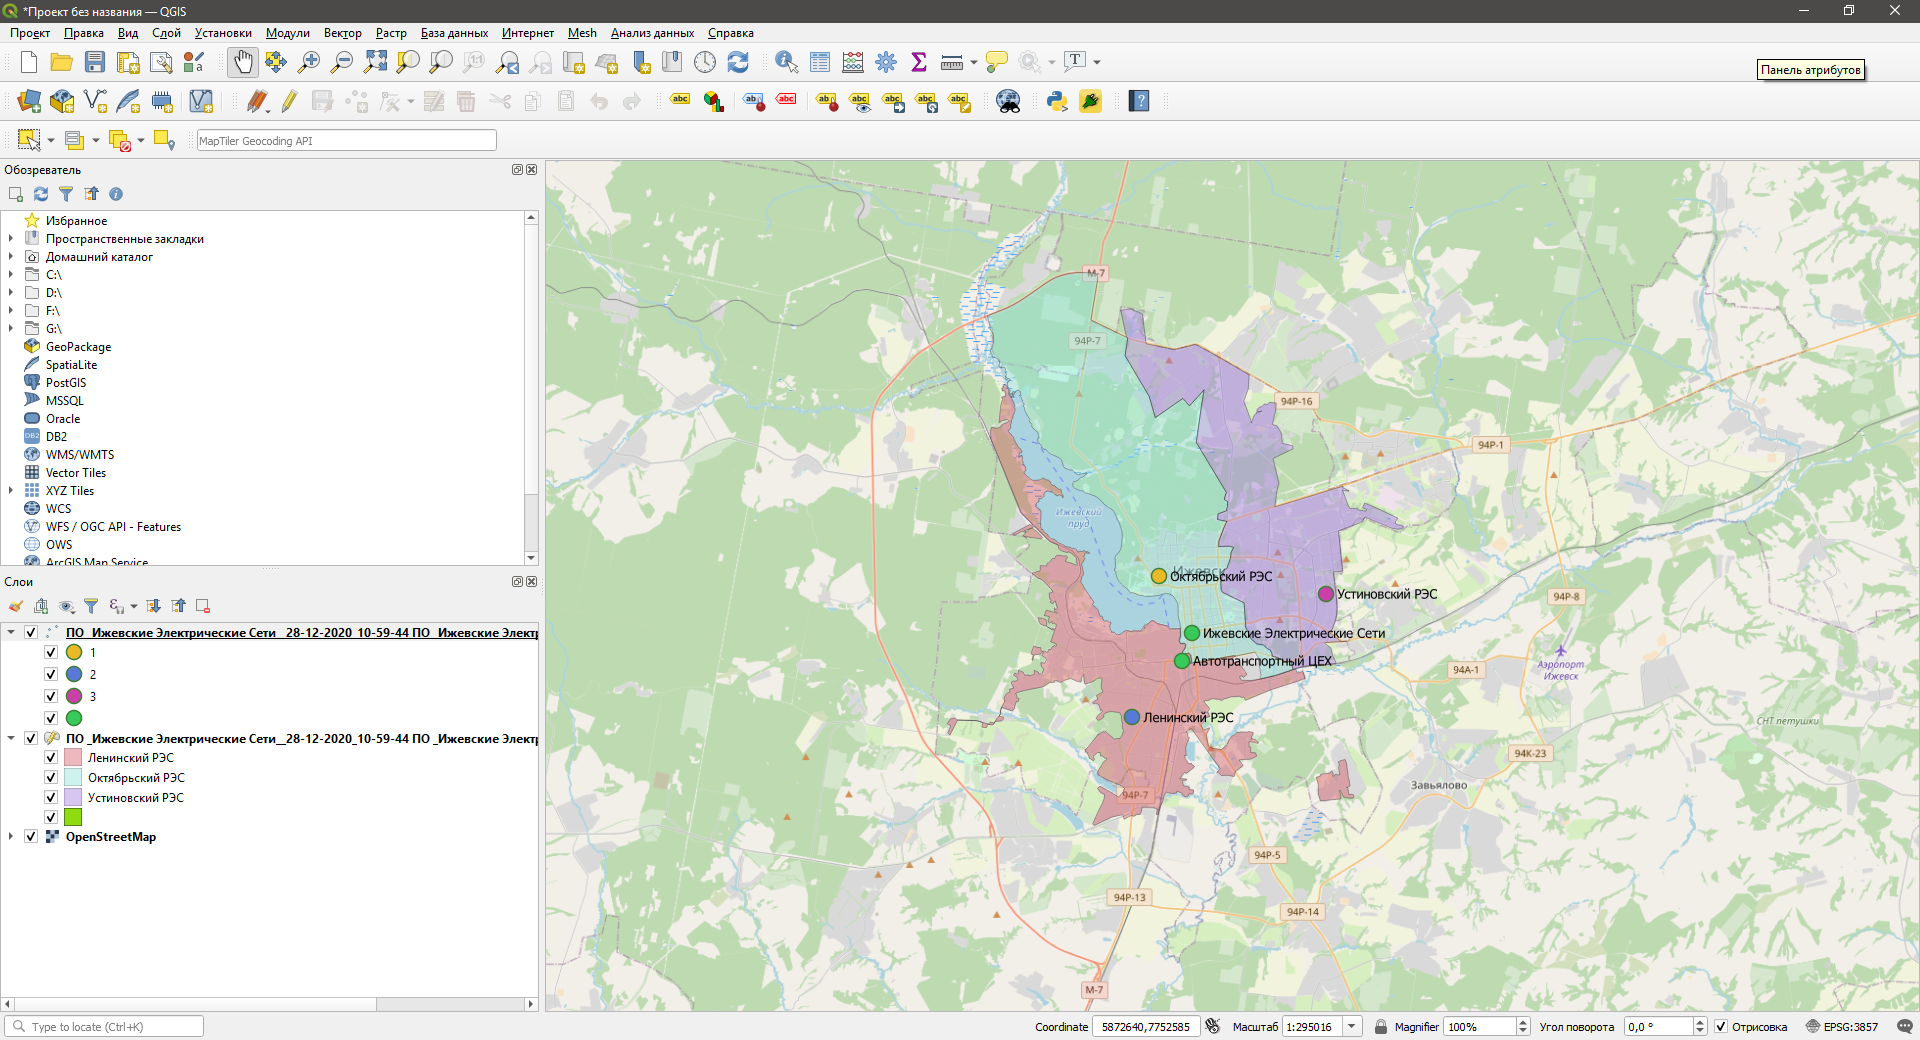
In general, it loads the data of the boundaries of the districts, adjust the style and you're done.
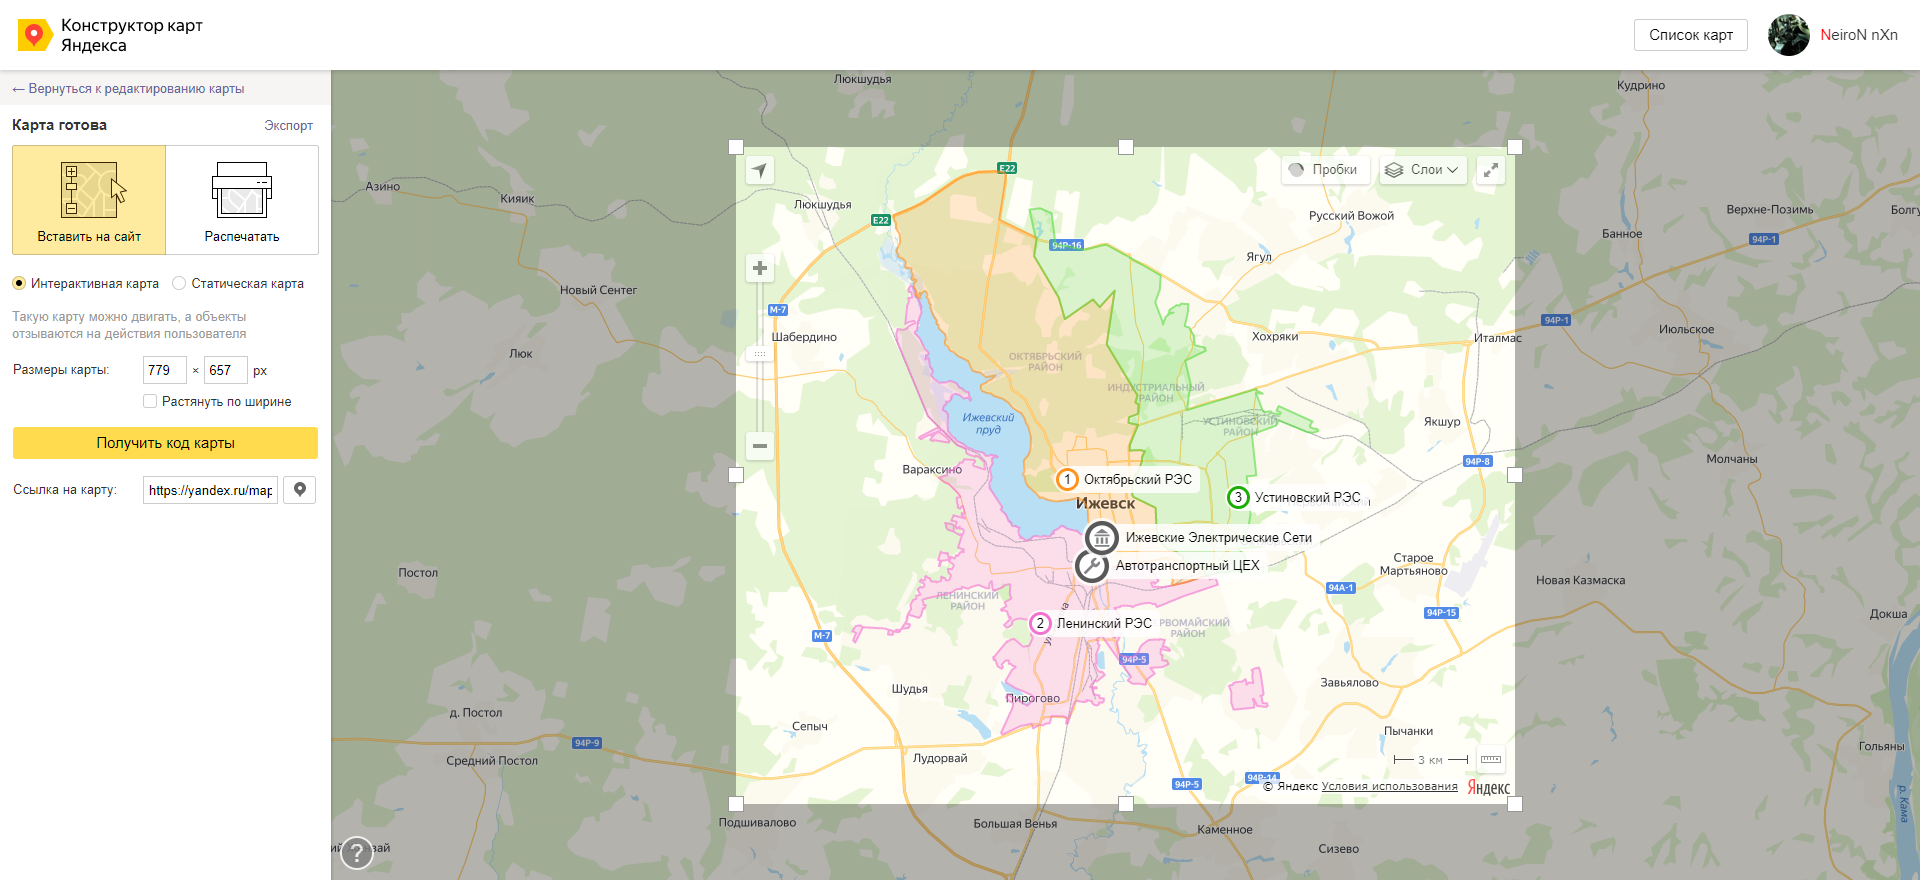
Let's say I have data in the Yandex.constructor (specific division into regions).

They can be easily imported into another GIS using the GeoJSON format for exchange

. It will be different with another data source, it makes no sense to analyze all possible options.
Didn't find what you were looking for?
Ask your questionAsk a Question
731 491 924 answers to any question