Answer the question
In order to leave comments, you need to log in
Why is the speed value displayed incorrectly in GRAFANA?
Good afternoon, there is Zabbix and Grafana.
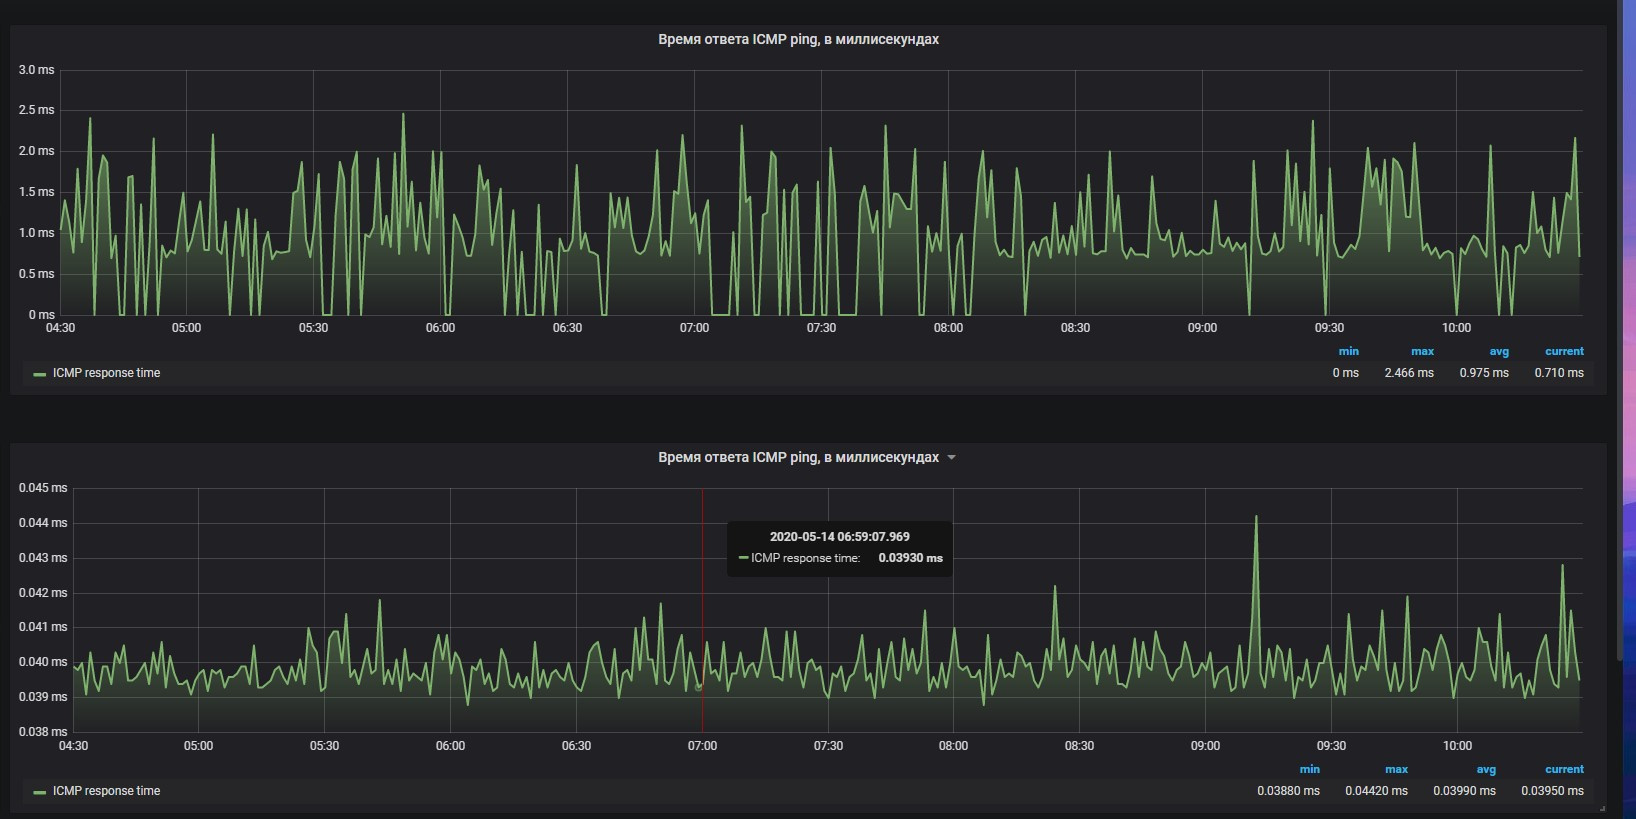
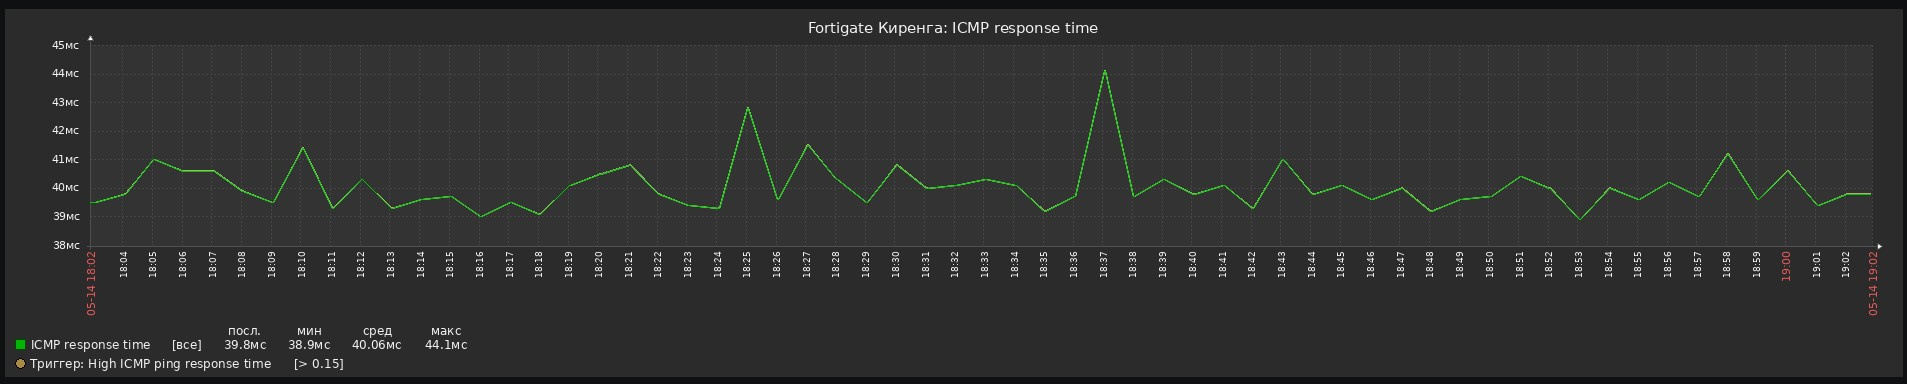
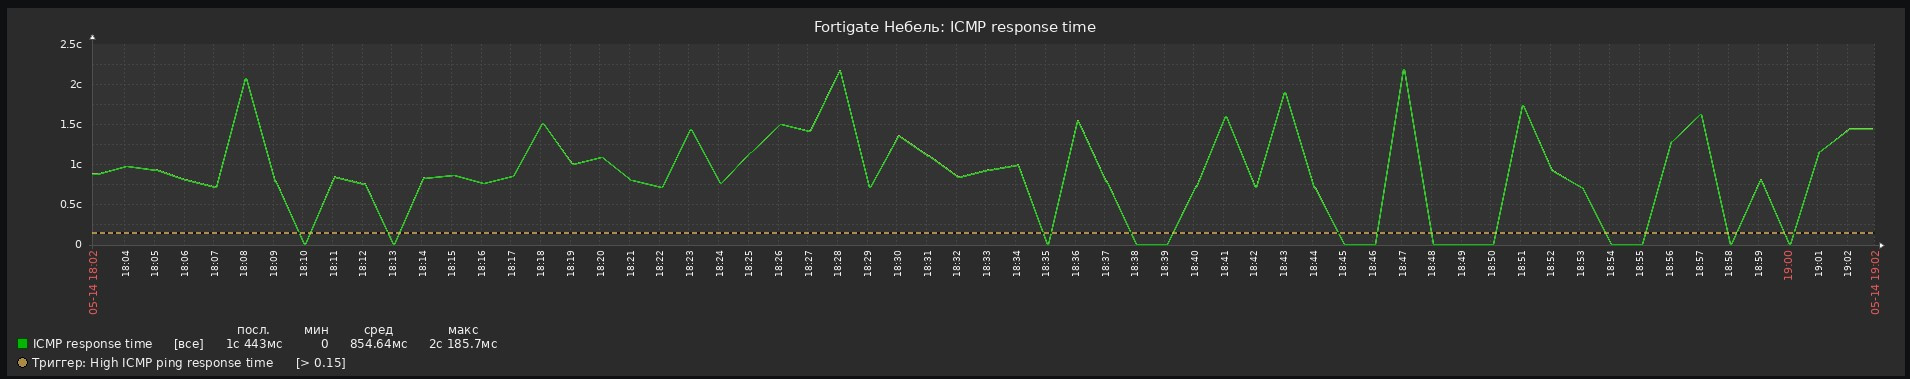
In Grafana, I set up a dashboard to display response time in ms. Here it is displayed correctly in Zabix (for example, 39.8ms and 1s 443ms), and in the Grafana dashboard, just 0.710ms and 0.03950/
Answer the question
In order to leave comments, you need to log in
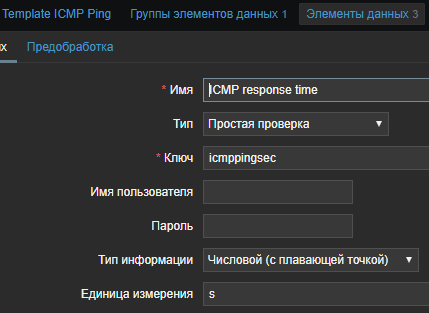
In Grafana, change the unit from milliseconds to seconds. If we look at the template in Zabbix, we will see that seconds are used there:
Didn't find what you were looking for?
Ask your questionAsk a Question
731 491 924 answers to any question