Answer the question
In order to leave comments, you need to log in
Why are there torn graphics in Grafana zabbix?
I threw grafana on zabbix 5.0.3, scattered the graphs, and in the moment I see that they turn out to be somehow torn.
Screenshot
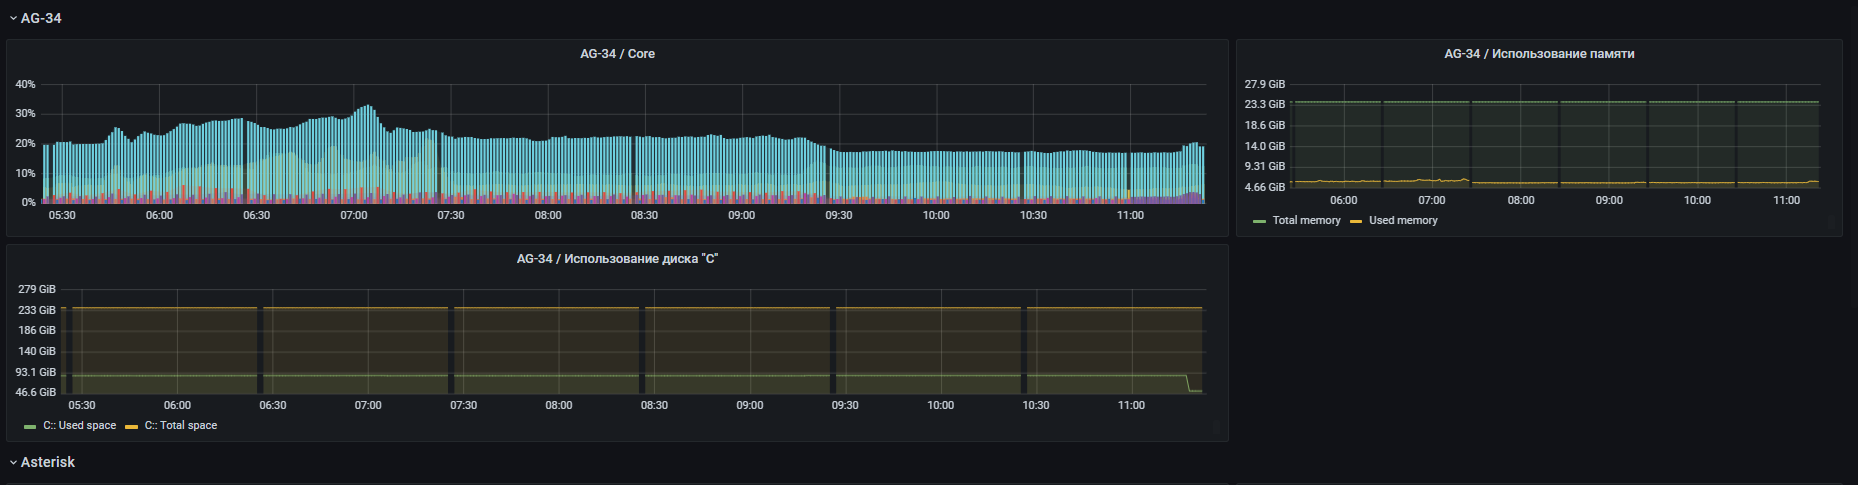
What could be the problem?
log/var/zabbix_server.log
1895256:20210617:111155.355 Starting Zabbix Server. Zabbix 5.0.3 (revision 146855bff3).
1895256:20210617:111155.355 ****** Enabled features ******
1895256:20210617:111155.355 SNMP monitoring:           YES
1895256:20210617:111155.355 IPMI monitoring:           YES
1895256:20210617:111155.355 Web monitoring:            YES
1895256:20210617:111155.355 VMware monitoring:         YES
1895256:20210617:111155.356 SMTP authentication:       YES
1895256:20210617:111155.356 ODBC:                      YES
1895256:20210617:111155.356 SSH support:               YES
1895256:20210617:111155.356 IPv6 support:              YES
1895256:20210617:111155.356 TLS support:               YES
1895256:20210617:111155.356 ******************************
1895256:20210617:111155.356 using configuration file: /etc/zabbix/zabbix_server.conf
1895256:20210617:111155.496 current database version (mandatory/optional): 05000000/05000002
1895256:20210617:111155.496 required mandatory version: 05000000
1895256:20210617:111155.546 server #0 started [main process]
1895263:20210617:111155.546 server #1 started [configuration syncer #1]
1895270:20210617:111156.952 server #2 started [ipmi manager #1]
1895272:20210617:111156.953 server #4 started [timer #1]
1895273:20210617:111156.954 server #5 started [http poller #1]
1895274:20210617:111156.955 server #6 started [discoverer #1]
1895277:20210617:111156.968 server #9 started [history syncer #3]
1895276:20210617:111156.973 server #8 started [history syncer #2]
1895278:20210617:111156.974 server #10 started [history syncer #4]
1895275:20210617:111156.975 server #7 started [history syncer #1]
1895279:20210617:111156.977 server #11 started [escalator #1]
1895280:20210617:111156.979 server #12 started [ipmi poller #1]
1895281:20210617:111156.980 server #13 started [ipmi poller #2]
1895283:20210617:111156.983 server #15 started [snmp trapper #1]
1895282:20210617:111156.984 server #14 started [ipmi poller #3]
1895284:20210617:111156.984 server #16 started [proxy poller #1]
1895271:20210617:111156.986 server #3 started [housekeeper #1]
1895285:20210617:111156.986 server #17 started [self-monitoring #1]
1895288:20210617:111156.991 server #18 started [task manager #1]
1895289:20210617:111156.993 server #19 started [poller #1]
1895292:20210617:111156.997 server #20 started [poller #2]
1895294:20210617:111157.000 server #22 started [poller #4]
1895293:20210617:111157.002 server #21 started [poller #3]
1895295:20210617:111157.013 server #23 started [poller #5]
1895298:20210617:111157.023 server #26 started [trapper #2]
1895297:20210617:111157.030 server #25 started [trapper #1]
1895296:20210617:111157.032 server #24 started [unreachable poller #1]
1895299:20210617:111157.036 server #27 started [trapper #3]
1895300:20210617:111157.038 server #28 started [icmp pinger #1]
1895301:20210617:111157.038 server #29 started [alert manager #1]
1895304:20210617:111157.052 server #31 started [alerter #2]
1895305:20210617:111157.052 server #32 started [alerter #3]
1895303:20210617:111157.064 server #30 started [alerter #1]
1895307:20210617:111157.079 server #33 started [preprocessing manager #1]
1895308:20210617:111157.083 server #34 started [preprocessing worker #1]
1895310:20210617:111157.083 server #36 started [preprocessing worker #3]
1895311:20210617:111157.084 server #37 started [lld manager #1]
1895309:20210617:111157.084 server #35 started [preprocessing worker #2]
1895312:20210617:111157.095 server #38 started [lld worker #1]
1895314:20210617:111157.097 server #40 started [alert syncer #1]
1895313:20210617:111157.097 server #39 started [lld worker #2]
1895296:20210617:111244.976 resuming Zabbix agent checks on host "Server 100.2 MvGHZhelezn24": connection restored
1895295:20210617:112128.886 Zabbix agent item "perf_instance_en.discovery[PhysicalDisk]" on host "Server 100.2 MvGHZhelezn24" failed: first network error, wait for 15 seconds
1895275:20210617:112154.563 item "Mikrotik 172.16.1.1 trash HQ:icmppingsec" became supported
1895275:20210617:112154.564 item "Mikrotik 172.16.1.1 trash HQ:icmppingloss" became supported
1895275:20210617:112154.564 item "Mikrotik 172.16.1.1 trash HQ:icmpping" became supported
1895296:20210617:112203.992 resuming Zabbix agent checks on host "Server 100.2 MvGHZhelezn24": connection restored
1895294:20210617:112326.262 Zabbix agent item "perf_counter_en["\Processor Information(_total)\% User Time"]" on host "AG-62" failed: first network error, wait for 15 seconds
1895296:20210617:112404.870 resuming Zabbix agent checks on host "AG-62": connection restored
1895295:20210617:112541.324 Zabbix agent item "perf_instance_en.discovery[PhysicalDisk]" on host "AG-34" failed: first network error, wait for 15 seconds
1895296:20210617:112616.299 resuming Zabbix agent checks on host "AG-34": connection restored
1895271:20210617:114157.112 executing housekeeper
1895271:20210617:114240.943 housekeeper [deleted 225330 hist/trends, 0 items/triggers, 0 events, 54 problems, 0 sessions, 0 alarms, 0 audit, 0 records in 43.829660 sec, idle for 1 hour(s)]
1895292:20210617:114341.704 Zabbix agent item "perf_instance_en.discovery[PhysicalDisk]" on host "Server 102.2 MvBib22" failed: first network error, wait for 15 seconds
1895296:20210617:114420.947 resuming Zabbix agent checks on host "Server 102.2 MvBib22": connection restored
1895289:20210617:114703.675 Zabbix agent item "perf_instance_en.discovery[PhysicalDisk]" on host "AG-46" failed: first network error, wait for 15 seconds
1895296:20210617:114741.310 resuming Zabbix agent checks on host "AG-46": connection restored
1895292:20210617:114919.649 Zabbix agent item "perf_instance_en.discovery[PhysicalDisk]" on host "AG-56" failed: first network error, wait for 15 seconds
1895296:20210617:114956.846 resuming Zabbix agent checks on host "AG-56": connection restored
1895295:20210617:115022.634 Zabbix agent item "perf_instance_en.discovery[PhysicalDisk]" on host "AG-33" failed: first network error, wait for 15 seconds
1895296:20210617:115059.521 resuming Zabbix agent checks on host "AG-33": connection restoredAnswer the question
In order to leave comments, you need to log in
Judging by the logs, you have some problems with network connectivity to the host. Either the truth is something with the network, or you need to smoke the settings of the zabbix server for the number of collector processes, memory, etc.
So it's more like the check doesn't fire regularly and doesn't write a value to the database.
Judging by the schedule of breaks, you may have, for example, some other check or other activity for 25 minutes, which is why the total load causes a timeout for Zabbix.
Didn't find what you were looking for?
Ask your questionAsk a Question
731 491 924 answers to any question