Answer the question
In order to leave comments, you need to log in
Which JavaScript charting library is right for you?
Good day to all! :)
I want to apologize in advance for such a stupid question.
Briefly: you need a JS library in which you can make aliases (your signatures) for the axes.
More details: in general, I needed to implement a graph in a web application, it must be created dynamically.
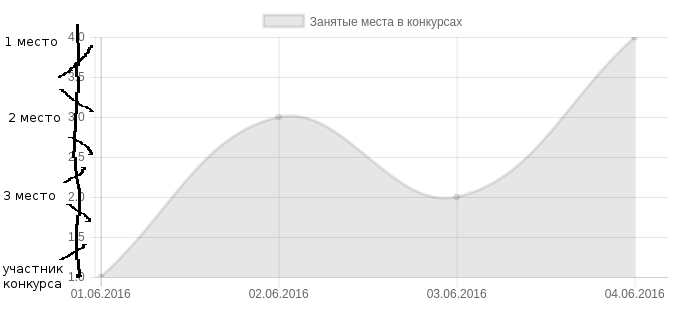
Initially I chose Chart.JS, a very good library, but it is not very suitable for my idea: I carefully flipped through the documentation several times and did not find how to customize the labels on the Y axis, it may sound funny, but it seems to me for my case this it would be necessary. I would like to do something similar to the graph below: 
Pass values, for example: for the first place - 4, for the second - 3, etc. - logical, but I would like to change the signatures. Chart.JS builds canvas charts, so writing a crutch to replace captions won't work either.
Answer the question
In order to leave comments, you need to log in
Thanks to everyone for the answers, yes D3.JS is a very cool and powerful thing, HighCharts.js too, but I would not want to drag such huge and complex libraries for one simple line chart.
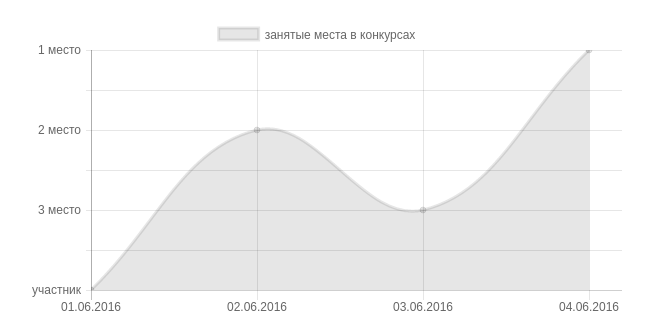
As it turned out, Chart.JS still has the ability to override the names of the Y-axis labels,
here is an example of a code that does what I need, but clumsily, but for a not quite standard chart it will do :)
var myLineChart = new Chart(ctx, {
  type: 'line',
  data: {
    labels: ['01.06.2016', '02.06.2016', '03.06.2016', '04.06.2016'],
    datasets: [{
      label: 'занятые места в конкурсах',
      data: [1, 3, 2, 4]
    }]
  },
  options: {
    scales: {
      yAxes: [{
        ticks: {
          callback: function(value, index, values) {
            if (value == 4) {
              return "1 место";
            } else if (value == 3) {
              return "2 место";
            } else if (value == 2) {
              return "3 место";
            } else if (value == 1) {
              return "участник";
            } else {
              return "";
            }
          }
        }
      }]
    }
  }
});
Take a look at d3.js - it is very flexible, you can definitely make any labels for the axes and labels in it. She, of course, was made by Predators for Aliens, but you can figure it out by examples (and there are dohrenillion of them ). Or perhaps there is a suitable one in C3 .
D3.js
Introduction to D3.js
Excellent free book Interactive Data Visualization for the Web
Didn't find what you were looking for?
Ask your questionAsk a Question
731 491 924 answers to any question