Answer the question
In order to leave comments, you need to log in
What should you pay attention to when profiling a web application?
Not so much developing sites, recently SPA, but for a long time the developers of google chrome presented a wonderful renderer and other dev tools. However, I did not use console for debugging. It is very interesting to know what professional front-end developers pay attention to when developing a web application in the browser dev tools.
Here, for example, I took a screenshot of the result of the UI authorization module. But it is not entirely clear what to do with it later and how this whole thing can help. For example, are there boundary conditions so that it is immediately clear that the results of the application are bad?
This is a screenshot of the authorization module in Angular 1 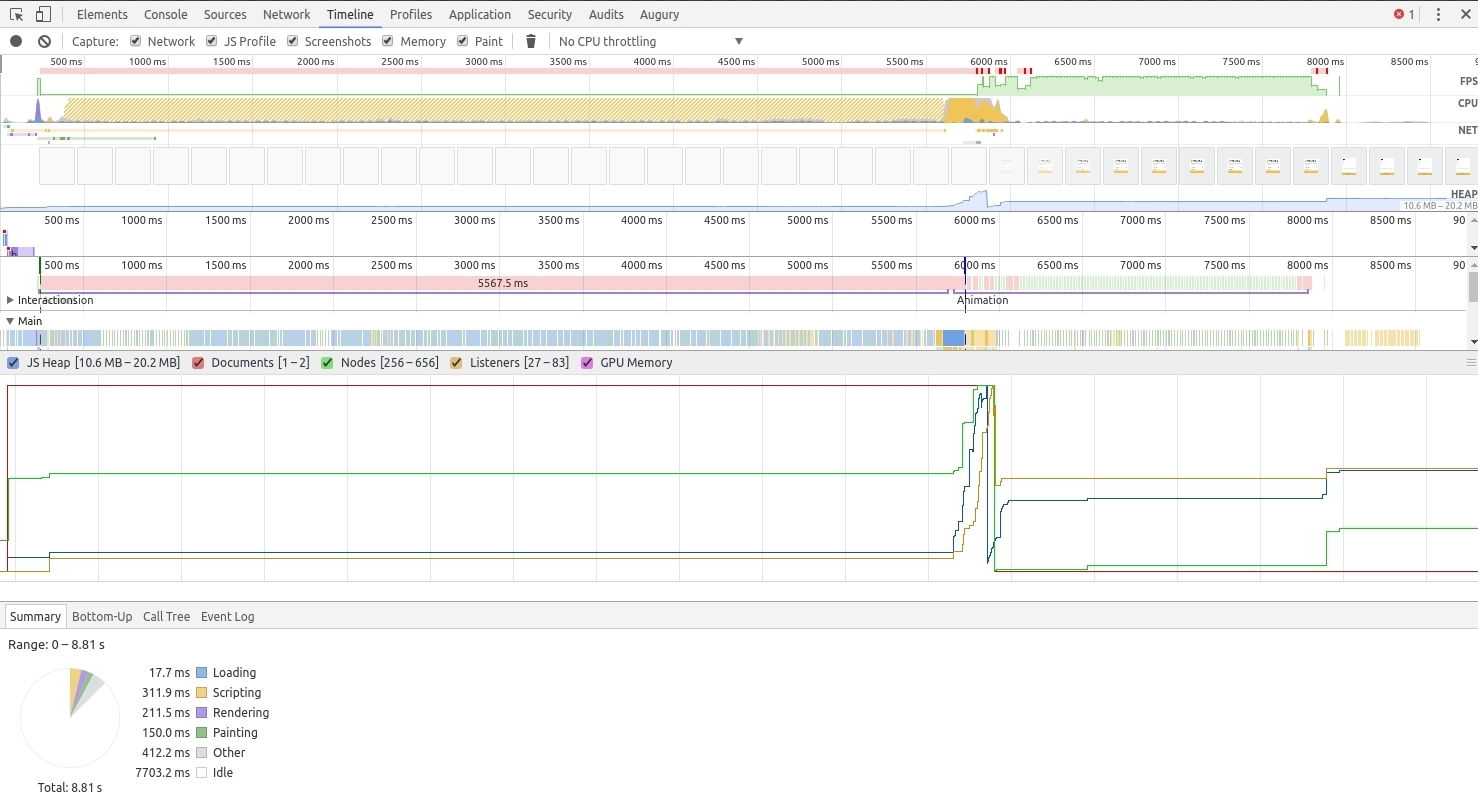 And now this is a screen of the authorization module in Angular 2
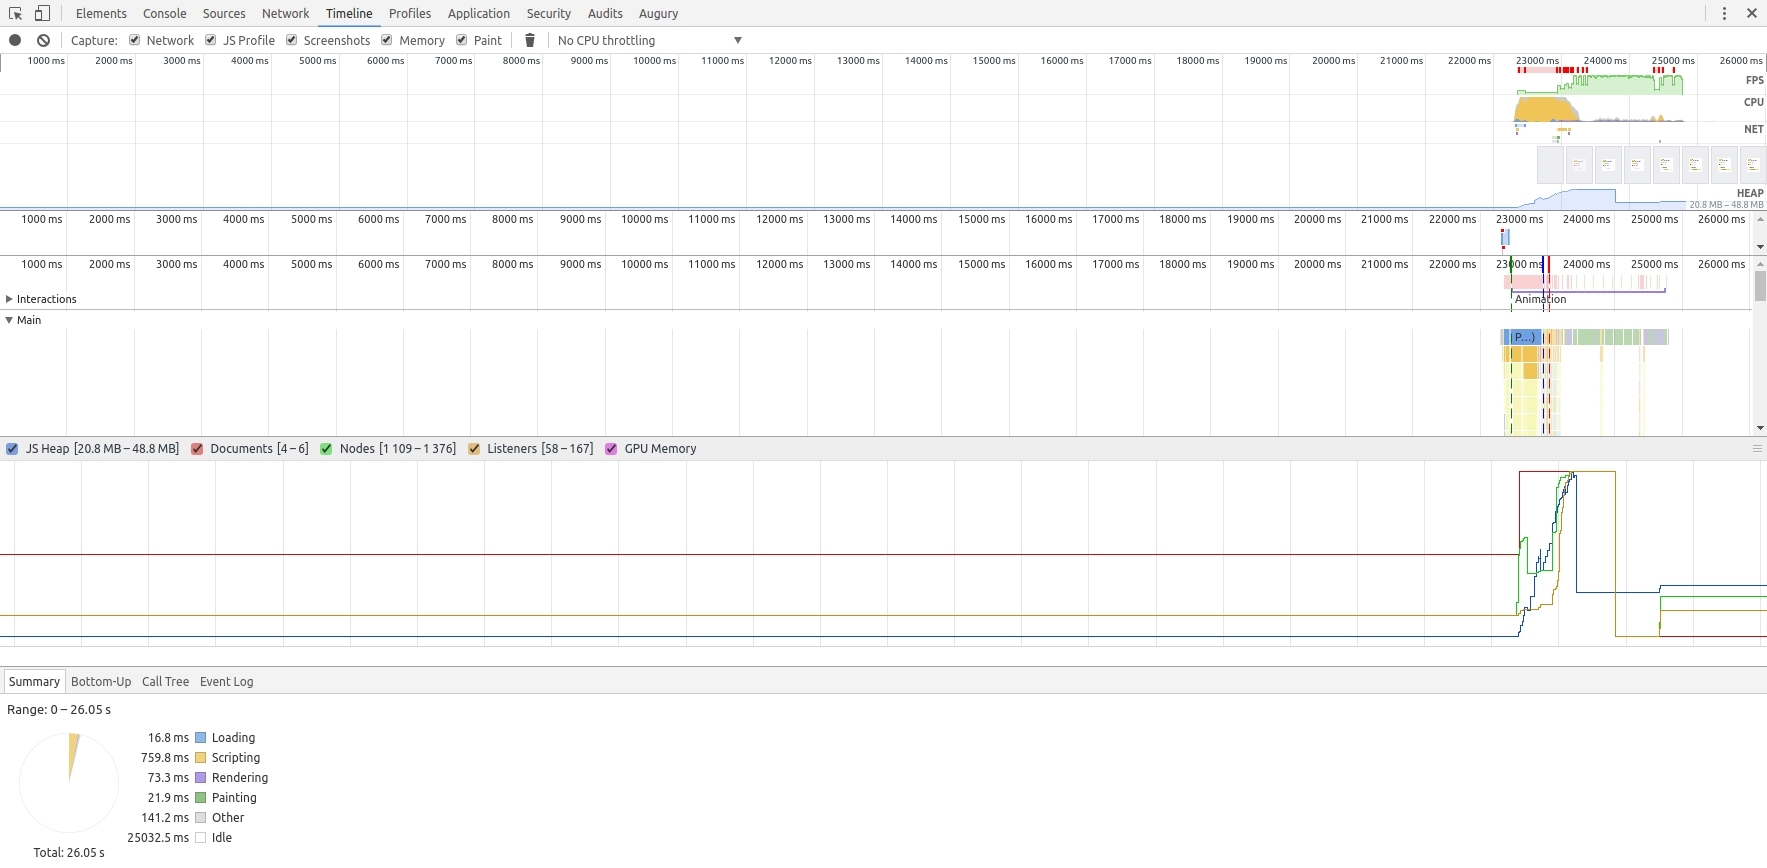
As you can see, the rendering and appearance has become much faster, but the consumption of RAM has increased and the execution of scripts has become much longer because the bundle is much larger than in Angular 1
How to assess whether the application has become worse or faster?
Answer the question
In order to leave comments, you need to log in
Didn't find what you were looking for?
Ask your questionAsk a Question
731 491 924 answers to any question