Answer the question
In order to leave comments, you need to log in
What library should be used to draw charts?
A project for predicting future data must use complex graphs consisting of many elements. I can’t find a suitable JS library for such rendering: 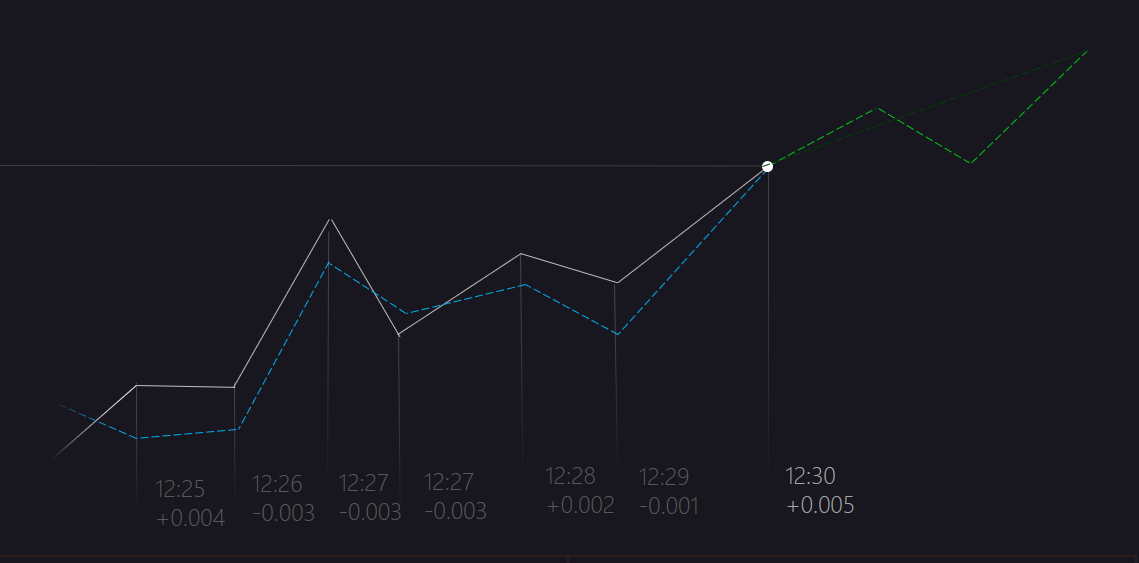
i.e. the library should be able to draw different parts of the chart in different colors with different sets of input data.
Sorry for the crooked picture :)
Answer the question
In order to leave comments, you need to log in
Very impressed with Google chart . I got the impression that any chart can be made on it. Very helpful in situations where conditions change frequently. “But it’s possible that the graph would be turned upside down”, “but we need a fixed from X to Y”, “but if there is no data, there should be a hole” ... and a lot of other Wishlist that could be implemented without any alteration of the system, I just had to specify the correct settings for the graphs.
Of the minuses, I would only note the need to really get stoned with documentation to figure out what you need to use from the settings in order to get what you want.
If the amount of displayed data is small (less than 100 points), then you can use SVG libraries (for example, I used C3.js - a very usable lib, based on D3). If there are many points, then it is better to choose charts with rendering in CANVAS.
Didn't find what you were looking for?
Ask your questionAsk a Question
731 491 924 answers to any question