Answer the question
In order to leave comments, you need to log in
Prometheus.yml file can't be written correctly?
I'm trying to attach monitoring to my API and it doesn't work, as I think, to write prometheus.yml correctly, or in the docker-compose file itself.
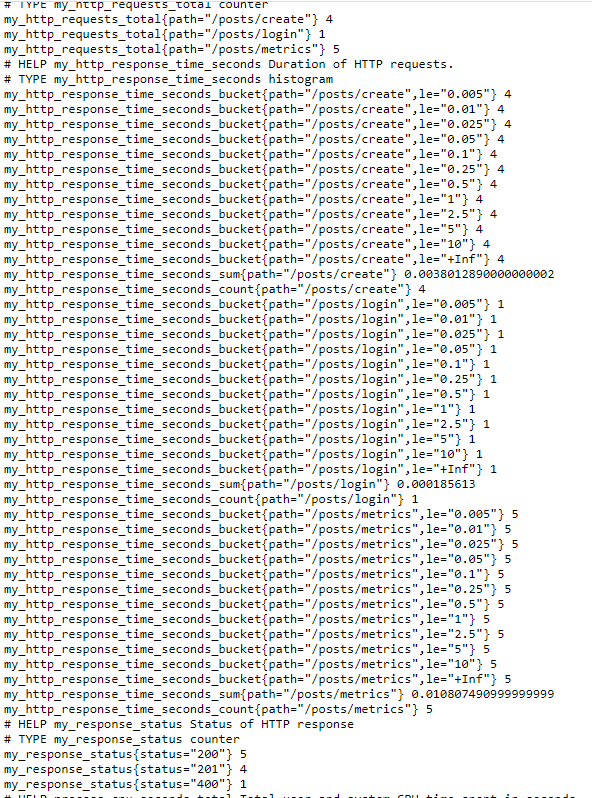
I made an add-on with my counters for prometheus and they work if I go directly to the address of the metrics,

but when I go to the address localhost: 9090 - the web interface does not see my counters and does not monitor them, respectively, and grafana similarly does not see anything.
Here is my prometheus.yml
global:
  scrape_interval:     15s # By default, scrape targets every 15 seconds.
  evaluation_interval: 15s # By default, scrape targets every 15 seconds.

scrape_configs:
  - job_name: prometheus
    static_configs:
      - targets: ['localhost:9090']
  - job_name: myCounters
    metrics_path: /posts/metrics           //это путь по которому читаются мои метрики "http://localhost:8085/posts/metrics"
    static_configs:
      - targets:
- http:8085version: "3.1"
services:
http:
container_name: "http_pr"
build:
context: "./"
dockerfile: "./docker/http.Dockerfile"
ports:
- "8085:8085"
environment:
PORT_HTTP: ":8085"
prometheus:
image: prom/prometheus:latest
volumes:
- ./prometheus:/etc/prometheus/
command:
- '--config.file=/etc/prometheus/prometheus.yml'
- '--storage.tsdb.path=/prometheus'
ports:
- 9090:9090
depends_on:
- http
grafana:
image: grafana/grafana:latest
ports:
- 3000:3000
depends_on:
- prometheusAnswer the question
In order to leave comments, you need to log in
Alexander Karabanov
thanks for the advice.
After rebooting the computer, everything worked, even did not reach the logs.
I don't know what it was about.
Thanks everyone and have a nice day!
Didn't find what you were looking for?
Ask your questionAsk a Question
731 491 924 answers to any question