P
P
powerful8882020-08-17 19:46:48
MySQL
powerful888, 2020-08-17 19:46:48

Mysql freezes due to the queue and sending data takes a very long time, why?

mysql freezes due to queue and very long execution of sending data, why ?
that is, for some reason it turns out that the request is being executed for a very long time, although the value is about tens of thousands, the server is multi-core and has a lot of operatives, M2 are hard, who knows what? options)?
the picture shows the option how it slows down, below the query option
(several sites) can ngix give something wrong?
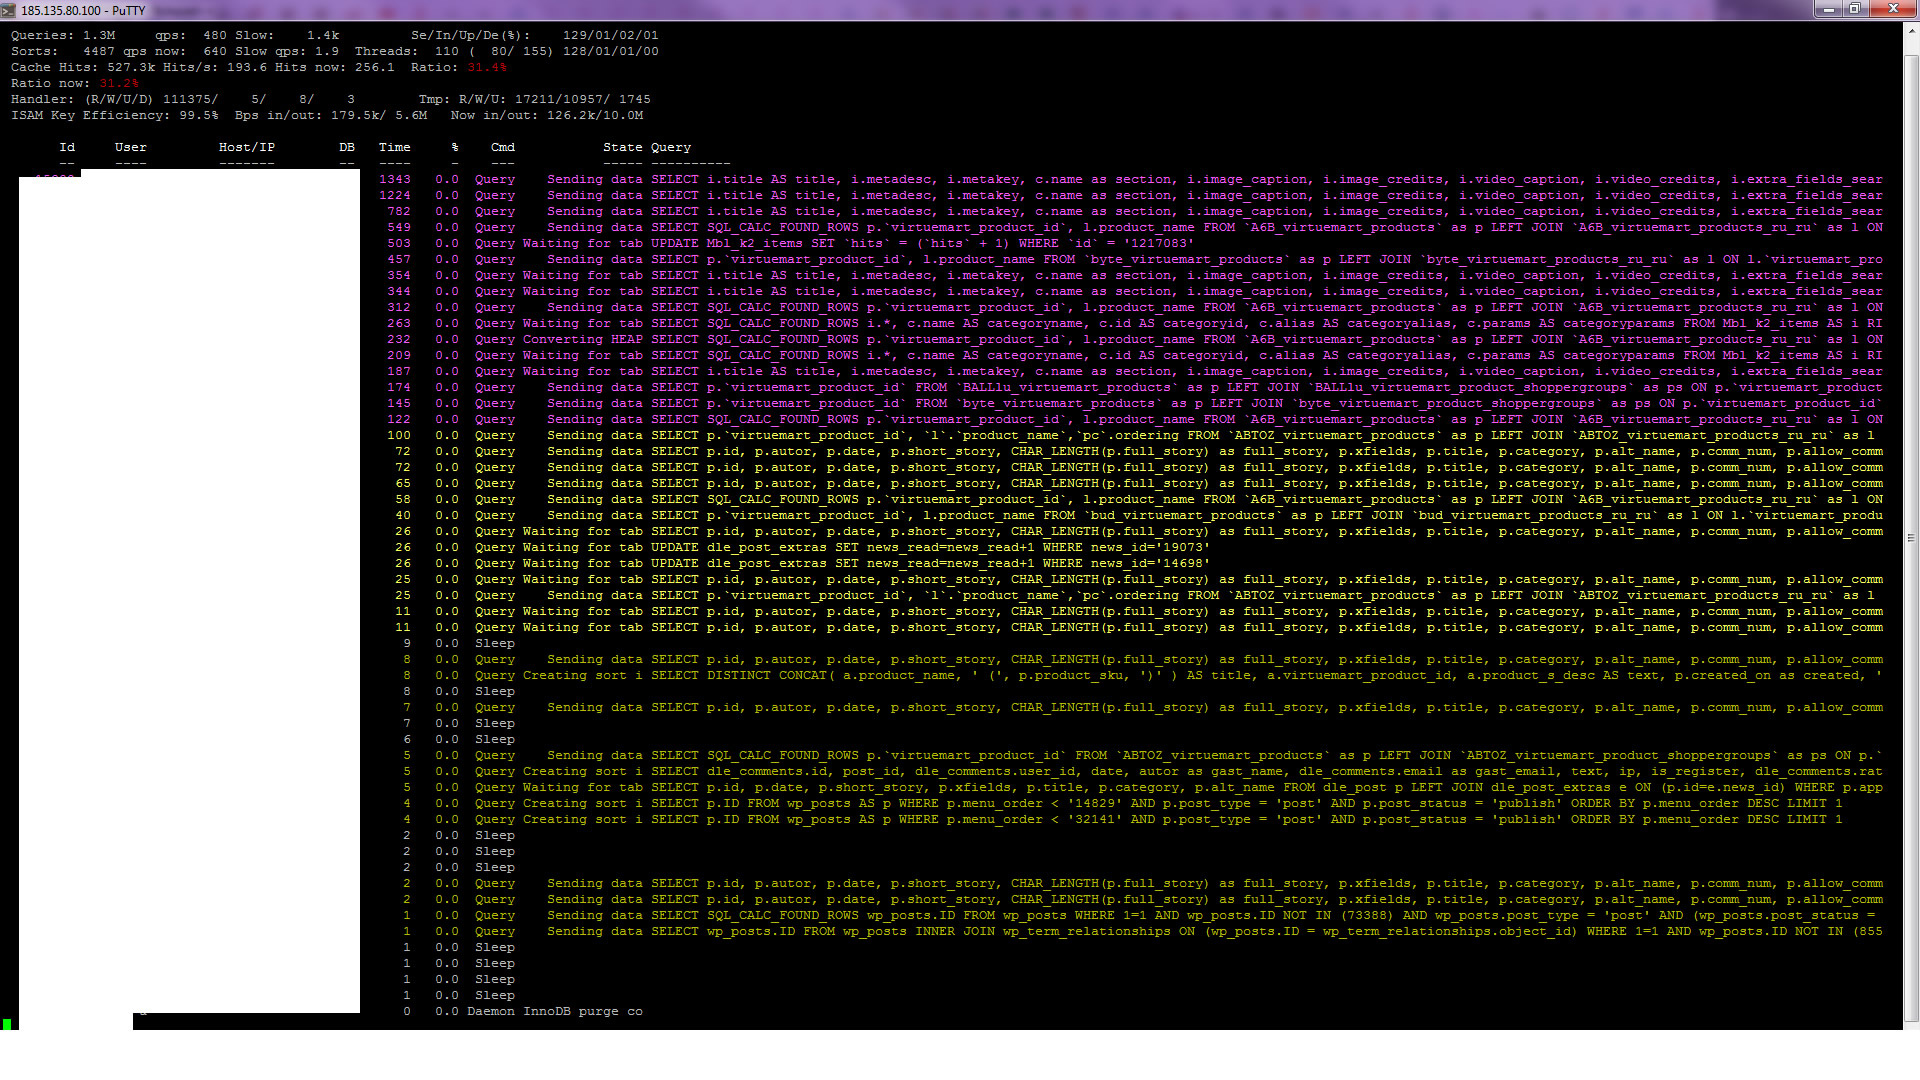
5f3ab3fd98be1728198787.jpeg

here is an example request

spoiler

EXPLAIN SELECT i.title AS title, i.metadesc, i.metakey, c.name as section, i.image_caption, i.image_credits, i.video_caption, i.video_credits, i.extra_fields_search, i.created, CONCAT(i.introtext, i.fulltext) AS text, CASE WHEN CHAR_LENGTH(i.alias) THEN CONCAT_WS(':', i.id, i.alias) ELSE i.id END as slug, CASE WHEN CHAR_LENGTH(c.alias) THEN CONCAT_WS(':', c.id, c.alias) ELSE c.id END as catslug FROM Mbl_k2_items AS i INNER JOIN Mbl_k2_categories AS c ON c.id = i.catid WHERE (( LOWER(i.title) LIKE '%??????????%' OR LOWER(i.introtext) LIKE '%??????????%' OR LOWER(i.`fulltext`) LIKE '%??????????%' OR LOWER(i.extra_fields_search) LIKE '%??????????%' OR LOWER(i.image_caption) LIKE '%??????????%' OR LOWER(i.image_credits) LIKE '%??????????%' OR LOWER(i.video_caption) LIKE '%??????????%' OR LOWER(i.video_credits) LIKE '%??????????%' OR LOWER(i.metadesc) LIKE '%??????????%' OR LOWER(i.metakey) LIKE '%??????????%' )) AND (( LOWER(i.title) LIKE '%????%' OR LOWER(i.introtext) LIKE '%????%' OR LOWER(i.`fulltext`) LIKE '%????%' OR LOWER(i.extra_fields_search) LIKE '%????%' OR LOWER(i.image_caption) LIKE '%????%' OR LOWER(i.image_credits) LIKE '%????%' OR LOWER(i.video_caption) LIKE '%????%' OR LOWER(i.video_credits) LIKE '%????%' OR LOWER(i.metadesc) LIKE '%????%' OR LOWER(i.metakey) LIKE '%????%' )) AND (( LOWER(i.title) LIKE '%?????%' OR LOWER(i.introtext) LIKE '%?????%' OR LOWER(i.`fulltext`) LIKE '%?????%' OR LOWER(i.extra_fields_search) LIKE '%?????%' OR LOWER(i.image_caption) LIKE '%?????%' OR LOWER(i.image_credits) LIKE '%?????%' OR LOWER(i.video_caption) LIKE '%?????%' OR LOWER(i.video_credits) LIKE '%?????%' OR LOWER(i.metadesc) LIKE '%?????%' OR LOWER(i.metakey) LIKE '%?????%' )) AND (( LOWER(i.title) LIKE '%??????%' OR LOWER(i.introtext) LIKE '%??????%' OR LOWER(i.`fulltext`) LIKE '%??????%' OR LOWER(i.extra_fields_search) LIKE '%??????%' OR LOWER(i.image_caption) LIKE '%??????%' OR LOWER(i.image_credits) LIKE '%??????%' OR LOWER(i.video_caption) LIKE '%??????%' OR LOWER(i.video_credits) LIKE '%??????%' OR LOWER(i.metadesc) LIKE '%??????%' OR LOWER(i.metakey) LIKE '%??????%' )) AND i.trash = 0 AND i.published = 1 AND i.access IN(1,1,2,13) AND c.published = 1 AND c.access IN(1,1,2,13) AND c.trash = 0 AND (i.publish_up = '0000-00-00 00:00:00' OR i.publish_up <= '2020-08-16 16:25:11') AND (i.publish_down = '0000-00-00 00:00:00' OR i.publish_down >= '2020-08-16 16:25:11') ORDER BY i.created DESC LIMIT 0, 50:

*** row 1 ***
table: i
type: index
possible_keys: item,catid
key: created
key_len: 5
ref: NULL
rows: 99
Extra: Using where
*** row 2 ***
table: c
type: eq_ref
possible_keys: PRIMARY,category,published,access,trash
key: PRIMARY
key_len: 4
ref: sql_Mb.i.catid
rows: 1
Extra: Using index condition; Using where


Here's another moment that might shed some light on the picture.

spoiler

Тут основная проблема с: со временем, когда приходит "более 45 обращений"(280 сайтов - собственно 280 пользователей mysql и столько же баз) и тут "запросы, что должны отработать быстро" - начинают висеть в базе. При этом часть других - выполняется за несколько секунд и быстрее.

[server]

[mysqld]

user = mysql
pid-file = /var/run/mysqld/mysqld.pid
socket = /var/run/mysqld/mysqld.sock
port = 3306
basedir = /usr
datadir = /var/lib/mysql
tmpdir = /tmp
lc-messages-dir = /usr/share/mysql
skip-external-locking

bind-address = 127.0.0.1

key_buffer_size = 64M
sort_buffer_size = 32M
read_rnd_buffer_size = 1M
#read_buffer_size = 10M
thread_stack = 192K
#thread_cache_size = 8

myisam_recover_options = BACKUP

query_cache_limit = 2M
#query_cache_size = 64M
query_cache_size = 256M

log_error = /var/log/mysql/error.log

expire_logs_days = 10

character-set-server = utf8mb4
collation-server = utf8mb4_general_ci

#skip-innodb
default-storage-engine = MYISAM
myisam-recover=backup,force

innodb_file_per_table = 1

##KOLDOBCTBO
#max_allowed_packet = 1024KB
max_allowed_packet = 4M
wait_timeout = 10
interactive_timeout = 10

max_connections = 300
max_user_connections = 10
#max_connections_per_hour = 60

connect_timeout = 2

innodb_buffer_pool_size = 1G

#open_files_limit = 1636400
open_files_limit = 16364000

table_open_cache = 8192

#innodb_buffer_pool_instances=8 # from 1 to minimize mutex contention
##innodb_page_cleaners=64 # will autolimit to be = b p instances
##join_buffer_size = 1M # disable to allow default to work for you
#thread_cache_size=100 # V8 CAP to avoid OOM
query_cache_min_res_unit=2000 # from 2K to for higher QC capacity
#innodb_print_all_deadlocks=ON # you need it in your error log and correct
#innodb_buffer_pool_dump_at_shutdown=ON # to prepare for WARM start
#innodb_buffer_pool_load_at_startup=ON # to avoid warmup time
#expire_logs_days=5 # to cover the weekends

#innodb_data_home_dir = /var/lib/mysql/
#innodb_log_group_home_dir = /var/lib/mysql/
#innodb_force_recovery = 3
#innodb_purge_threads = 0
#innodb_buffer_pool_size = 64MB
#tmp_table_size = 512MB
innodb_log_file_size=512M

#max_heap_table_size = 512MB
## MyISAM #
#key-buffer-size = 64M
#myisam-recover = FORCE,BACKUP
## SAFETY #
#max-allowed-packet = 16M
#max-connect-errors = 1000000
## BINARY LOGGING #
#expire-logs-days = 14
#sync-binlog = 1
## CACHES AND LIMITS #
#tmp-table-size = 32M
#max-heap-table-size = 32M
#query-cache-type = 0
#query-cache-size = 0
#max-connections = 500
#thread-cache-size = 50
#open-files-limit = 65535
#table-definition-cache = 4096
#table-open-cache = 10240
## INNODB #
#innodb-flush-method = O_DIRECT
#innodb-log-files-in-group = 2
#innodb-log-file-size = 256M
#innodb-flush-log-at-trx-commit = 1
#innodb-file-per-table = 1
#innodb-buffer-pool-size = 10G
## LOGGING #
#log-error = /var/log/mysql/mysql-error.log
log-queries-not-using-indexes = 1
slow-query-log = 1
slow-query-log-file = /var/log/mysql/mysql-slow.log

#log_bin=ON
#max_binlog_size = 100M

#KOLDOBCTBO-OTLADKA
#general_log = 1

[embedded]

[mariadb]

[mariadb-10.1]

Answer the question

In order to leave comments, you need to log in

3 answer(s)
P
powerful888, 2020-08-21
@powerful888

In short, the matter was in the physical plate, the operatives
talked here and decided
https://debianforum.ru/index.php/topic,16064.new.h...

L
Lazy @BojackHorseman MySQL, 2020-08-17
Tag

LIKE is slow by definition.
can it turn out to concatenate all this into one field and hang a full-text index on it?
there are all sorts of sphinxes for this (( why force a muscle (
and you can also think about applying like not for all records, but for those that satisfy the rest of the conditions. Greedy calculations, yes, and you can think about indexes, I think the original table can be traversed faster than created, given the selection.

R
Roman Mirilaczvili, 2020-08-20
@2ord

Judging by iotop, MariaDB is working. Moreover, in the aggregate, requests intensively work on writing, and not on reading. Possibly to create temporary tables.
If this is shared hosting, then there is nothing special to do here. Unless to offer hosting tenants an improved version of their software.
I doubt it's just the one query given in the question.
First of all, I would analyze slow queries (slow query log).

Didn't find what you were looking for?

Ask your question

Ask a Question

731 491 924 answers to any question