Answer the question
In order to leave comments, you need to log in
Mathematics of motion - how to relate the position of objects through bezier curve formulas?
Hello.
Please help me with the math. I can’t figure out where to find and how to apply the correct formulas.
I need to relate the position of an object along the y-axis to the position of the scroll, but the relationship is not linear. And I need to be able to configure this dependency. Therefore, I want to somehow connect the position of the object and the scroll through the bezier curve formulas.
I found formulas for bezier curves , but I can't figure out how to apply them in my case. There, the vector form is decomposed into formulas for each projection, but it doesn’t suit me that way. It would suit me if I could get t from a known projection on the Y axis, and already using t get X. But I do not have enough knowledge to invert the formula.
Here is the dependency graph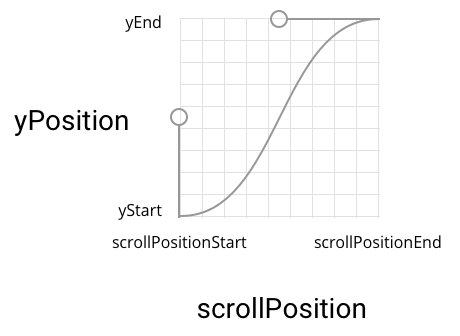
Please push in the right direction. Thank you.
Answer the question
In order to leave comments, you need to log in
Judging by the fact that for some values of the points the curve can intersect with itself, there is no simple solution.
On CO in a similar question for points
P0 = (X0,Y0)
P1 = (X1,Y1)
P2 = (X2,Y2)
P3 = (X3,Y3)X(t) = (1-t)^3 * X0 + 3*(1-t)^2 * t * X1 + 3*(1-t) * t^2 * X2 + t^3 * X3
Y(t) = (1-t)^3 * Y0 + 3*(1-t)^2 * t * Y1 + 3*(1-t) * t^2 * Y2 + t^3 * Y3In your text there is a link to the entry of the "Bezier curve formula", where the de Casteljo's Algorithm is described. It is easier to program it in my opinion, let it be the PointF LinP(Point[ ] p, double t) method, which for the coordinates of 4 points specified in the p array for any t on the segment [0,1] calculates the coordinates of the point q ( qX, qY).
For the implementation of the algorithm, see c-sharp.pro/?p=1164 .
Further, it is important that your Bezier curve is a single-valued function (in the sense of the task for the engine). Then, for a given position of the slider yz on the segment [Start, End], by dividing the segment [0,1] in half, you will find such a t for which | yz-qY | <eps. Then the desired X = qX
If you really want to see how it looks in the code, then here is https://github.com/gre/bezier-easing , all the sources are there.
If you want to take it right here and apply the finished one, then the link above is similar, or gsap and ease-visualizer
The graph drawn by you is normally described by a sine-type function in the range from -Pi/2 to +Pi/2, you just need to adjust the coordinates.
Well, or you can take a function like xx^3 in the range from -1/sqrt(2) to +1/sqrt(2). Coordinates will also need to be adjusted.
Taylor, as it were, hints that the two options I proposed are similar for a reason.
Didn't find what you were looking for?
Ask your questionAsk a Question
731 491 924 answers to any question