Answer the question
In order to leave comments, you need to log in
java server load graph?
In general, there is a schedule, this is testing the peak load on the server. The point is that there are 400 users and everyone logs in, makes a couple of simple requests and then logs out, waits 20 seconds and again.
I started to watch the memory, it grows very much in 1 hour, then the server falls off with outofmemory
After I remove the load, the memory seems to return to normal.
What is meant by memory fascination? Is my server not keeping up with requests? How can this be analyzed further?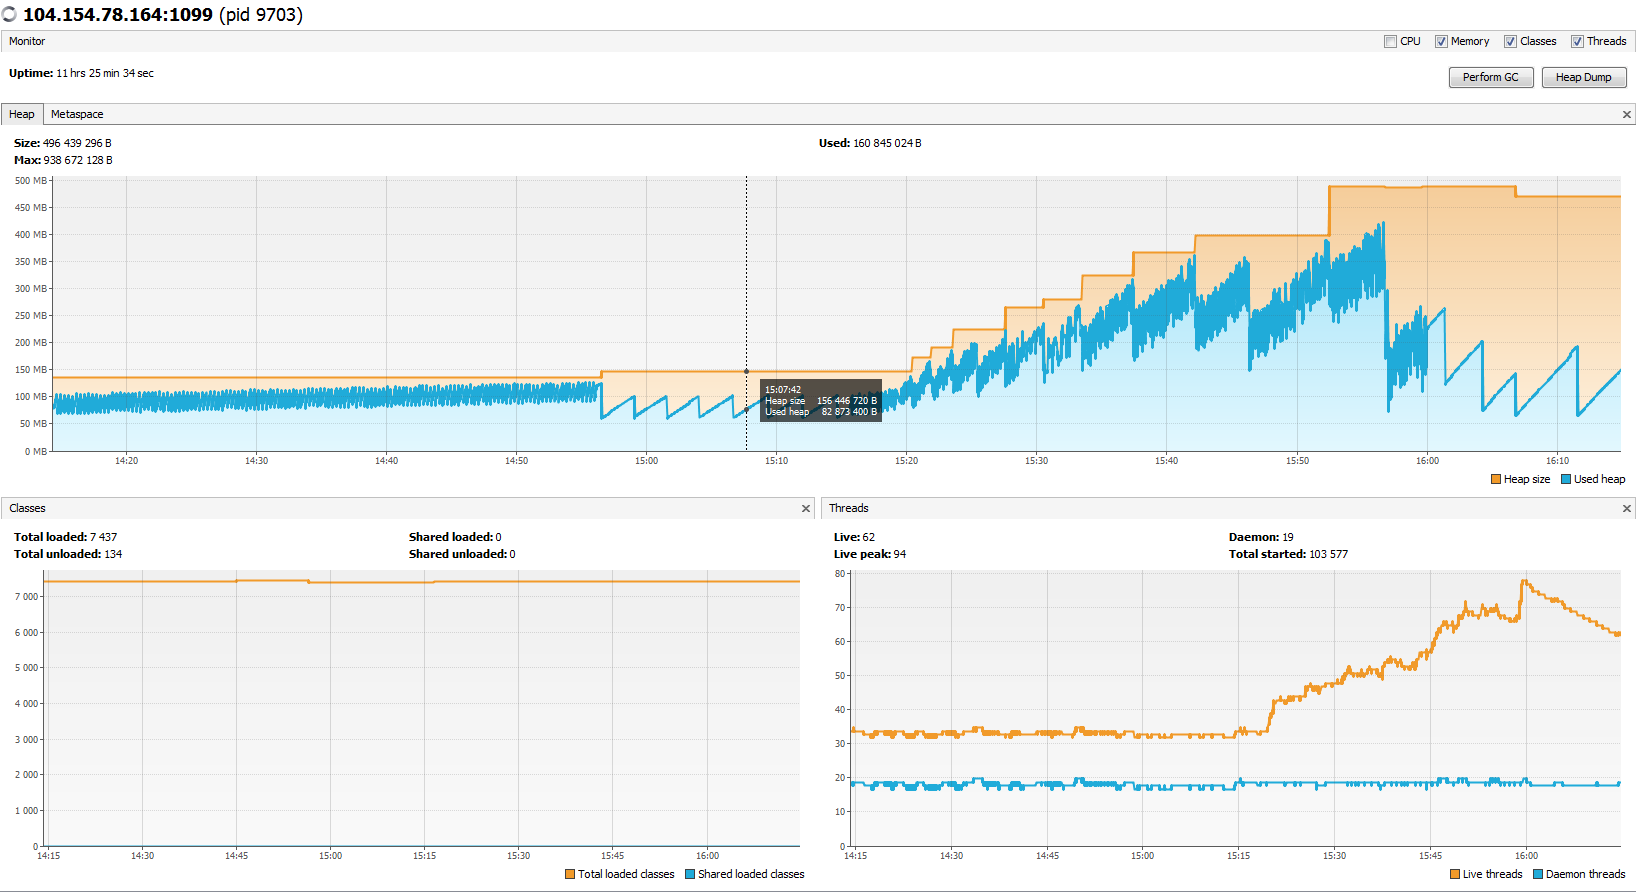
Answer the question
In order to leave comments, you need to log in
Look, permgen and hip, how evenly they grow and what overflows.
Also try the following Java settings:
-XX:+UseConcMarkSweepGC -XX:+UseParNewGC -XX:+DisableExplicitGC
When you understand who is overeating, hip or perm, take a dump and give it to the developers. Let them fix the leaks.
If you use Tomcat7, through the manager, try clicking the "Find memorial" button and analyze it.
Perhaps you have something large stored in the user session or even accumulated.
Try experimenting with different numbers of users.
Perhaps when the user exits the session is not deleted, but is deleted later by a timeout.
You can run it with a profiler and see where the memory is being spent.
Didn't find what you were looking for?
Ask your questionAsk a Question
731 491 924 answers to any question