Answer the question
In order to leave comments, you need to log in
How to understand the CPU graph on a free Google Cloud server?
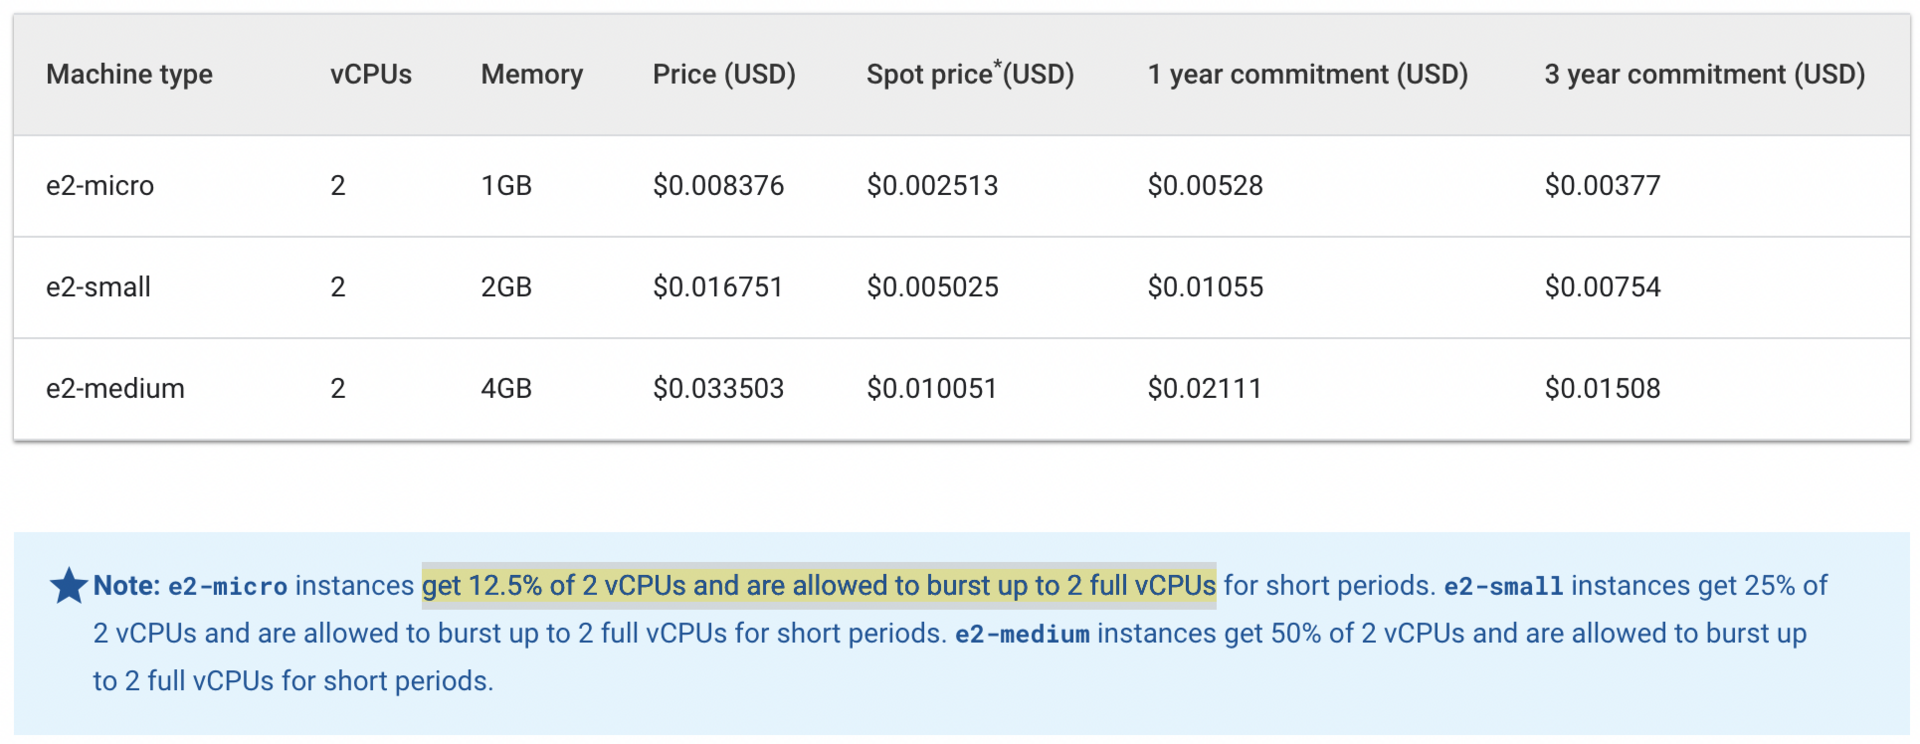
e2-micro instances receive 12.5% of 2 VCPUs and are allowed to run up to 2 full VCPUs for short periods of time.
Answer the question
In order to leave comments, you need to log in
No not like this.
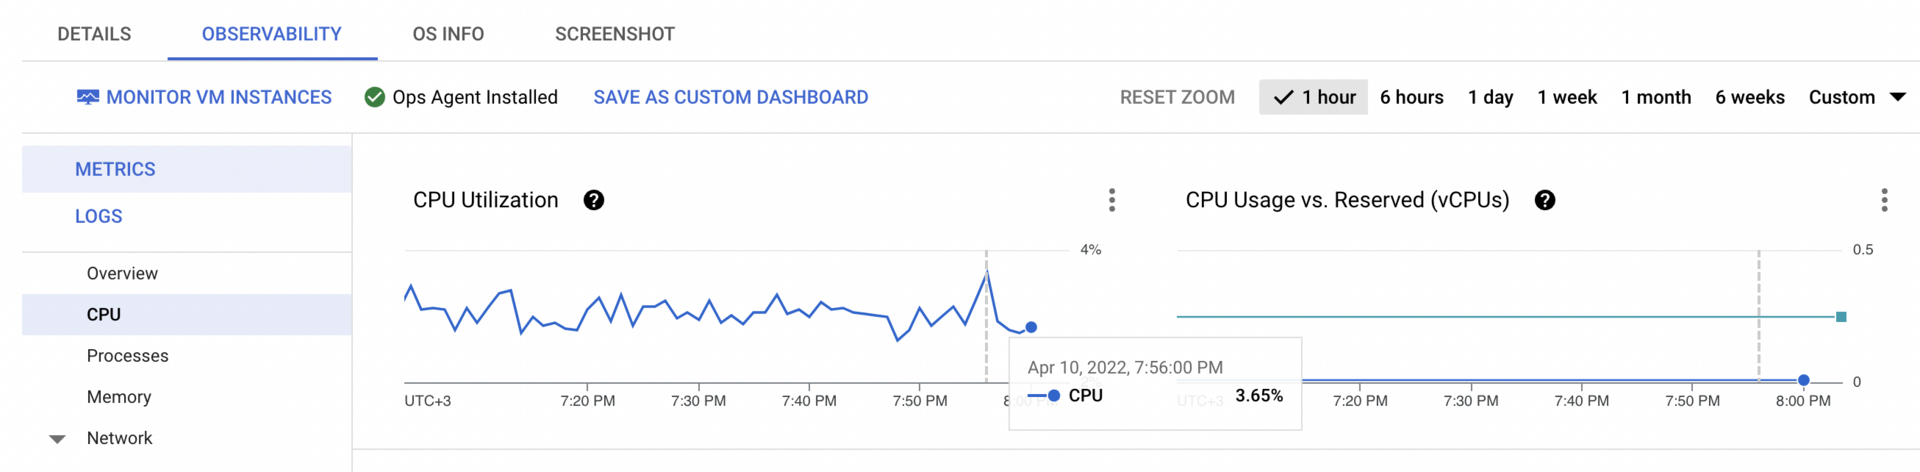
The left graph is the actual utilization of both CPUs. Those. 3.65% is at the peak both CPUs have created such a load.
On the right, the CPU load graph when credits are exhausted will be the maximum allowed load of 12.5% * 2 = 25%
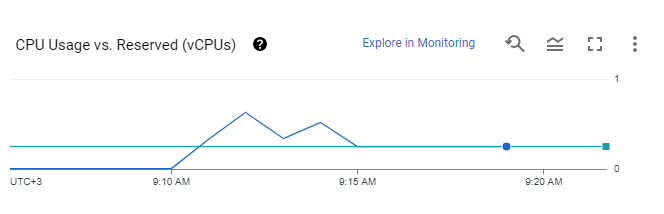
I.e. instances can work quickly, but not for long -) after the "credit" is exhausted, they begin to troll. After the load is below 12.5% on the processor, these credits will accumulate again, and your machine will again be able to take 100% of the processor in peaks.
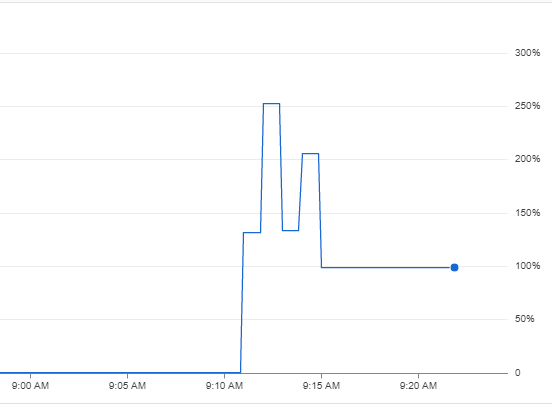
Pictures (9:10 stress test at 100% cpu):
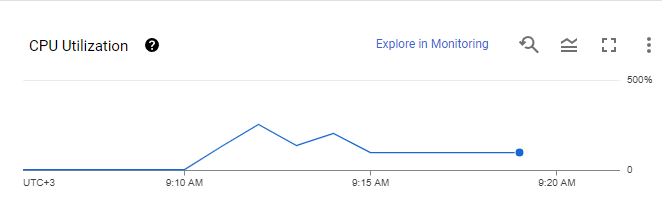
CPU load graph:
Didn't find what you were looking for?
Ask your questionAsk a Question
731 491 924 answers to any question