Answer the question
In order to leave comments, you need to log in
How to track down functions that create JS memory leaks in Chrome?
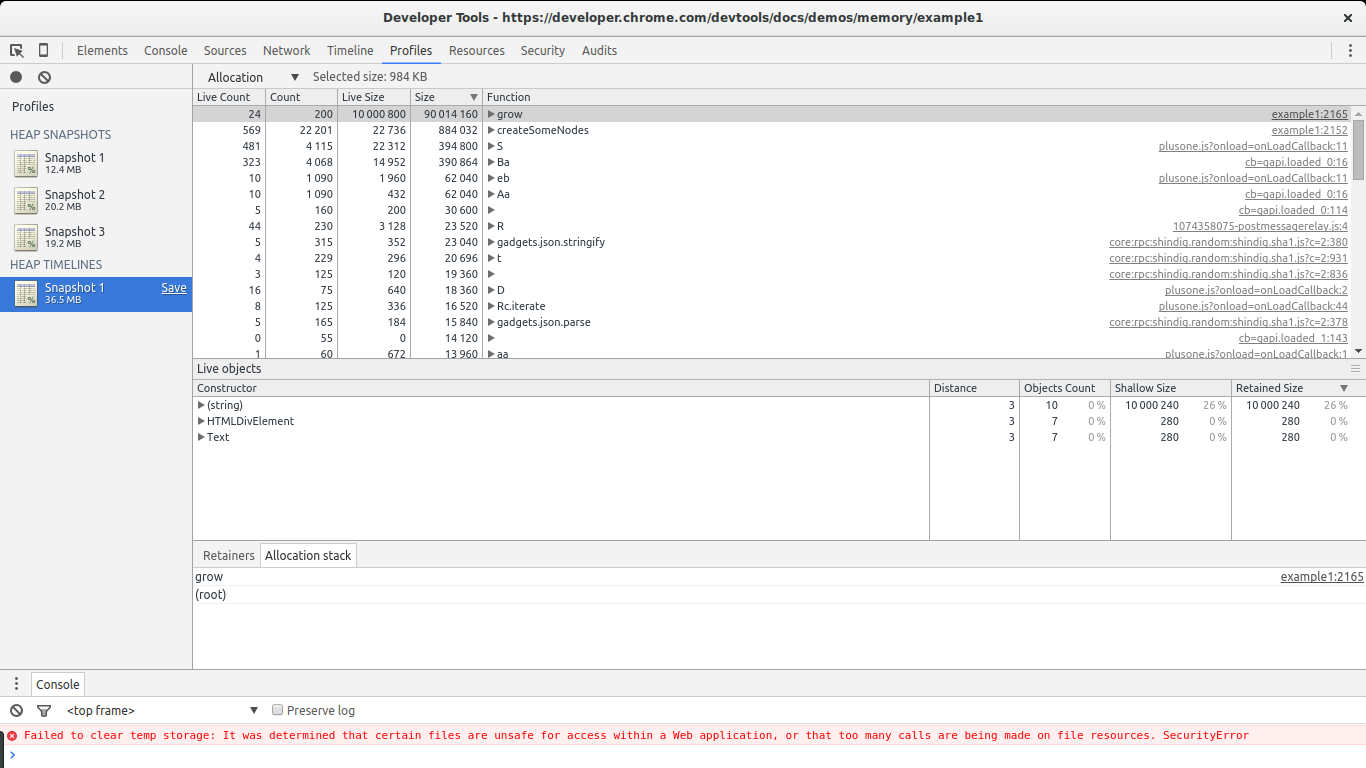
I came across an article on Habré about memory leaks ( https://habr.com/en/post/309318/ ). And there it was said about " record heap allocation stack traces " in the settings and about the Allocation mode , which allows you to identify functions / objects where the leak occurs.
The article was written in 2016 and now a lot has changed and these options cannot be found.
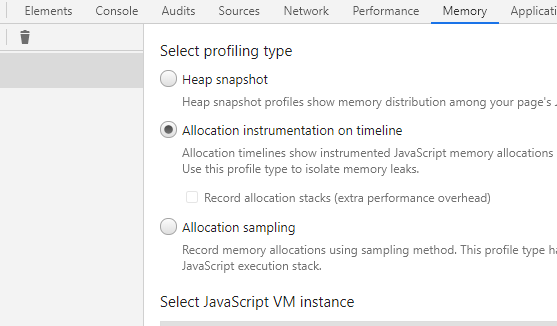
All that was found is in the Memory tab there is an item " Allocation instrumentation on timeline " and below there is an option " record allocation stacks " which for some reason cannot be activated.
Tell me, how can you now track the functions \ objects in which leaks occur in DevTools chrome?
ps Now this is the view in Memory
But this one is given in the article (here the functions \ objects are indicated and opposite the script and the line)
Answer the question
In order to leave comments, you need to log in
Didn't find what you were looking for?
Ask your questionAsk a Question
731 491 924 answers to any question