Answer the question
In order to leave comments, you need to log in
How to set up vAxis in google charts?
Good day.
I'm trying to make a graph similar to the one attached 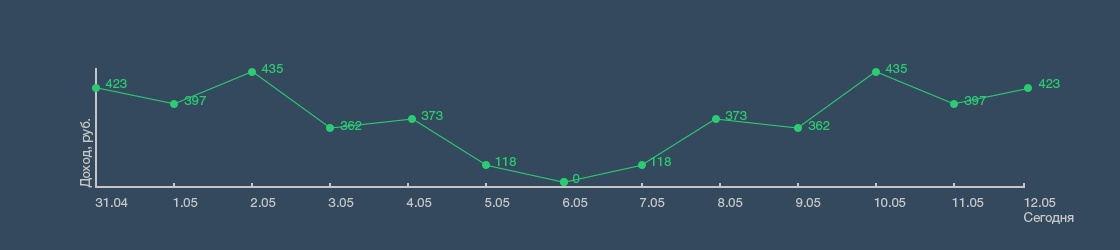
but I can't handle the grid count and how to add a baseline to vAxis + it's not clear how to hide data from vAxis and show only the title + how to set a line that is on hAxis I
'm sorry, but I’m apparently stupid and can’t find something sensible in the documentation from google in the form of a list of options that are generally available, if it is possible to attach such a link, then I will be very grateful
link with the result: https://jsfiddle.net/7hgu9uww/1 /
Answer the question
In order to leave comments, you need to log in
Didn't find what you were looking for?
Ask your questionAsk a Question
731 491 924 answers to any question