Answer the question
In order to leave comments, you need to log in
How to set up debugging in phpstorm?
Hello, I can’t set up debugging in phpstorm, I do everything as in the lesson https://habrahabr.ru/post/250323/
Screen php.ini 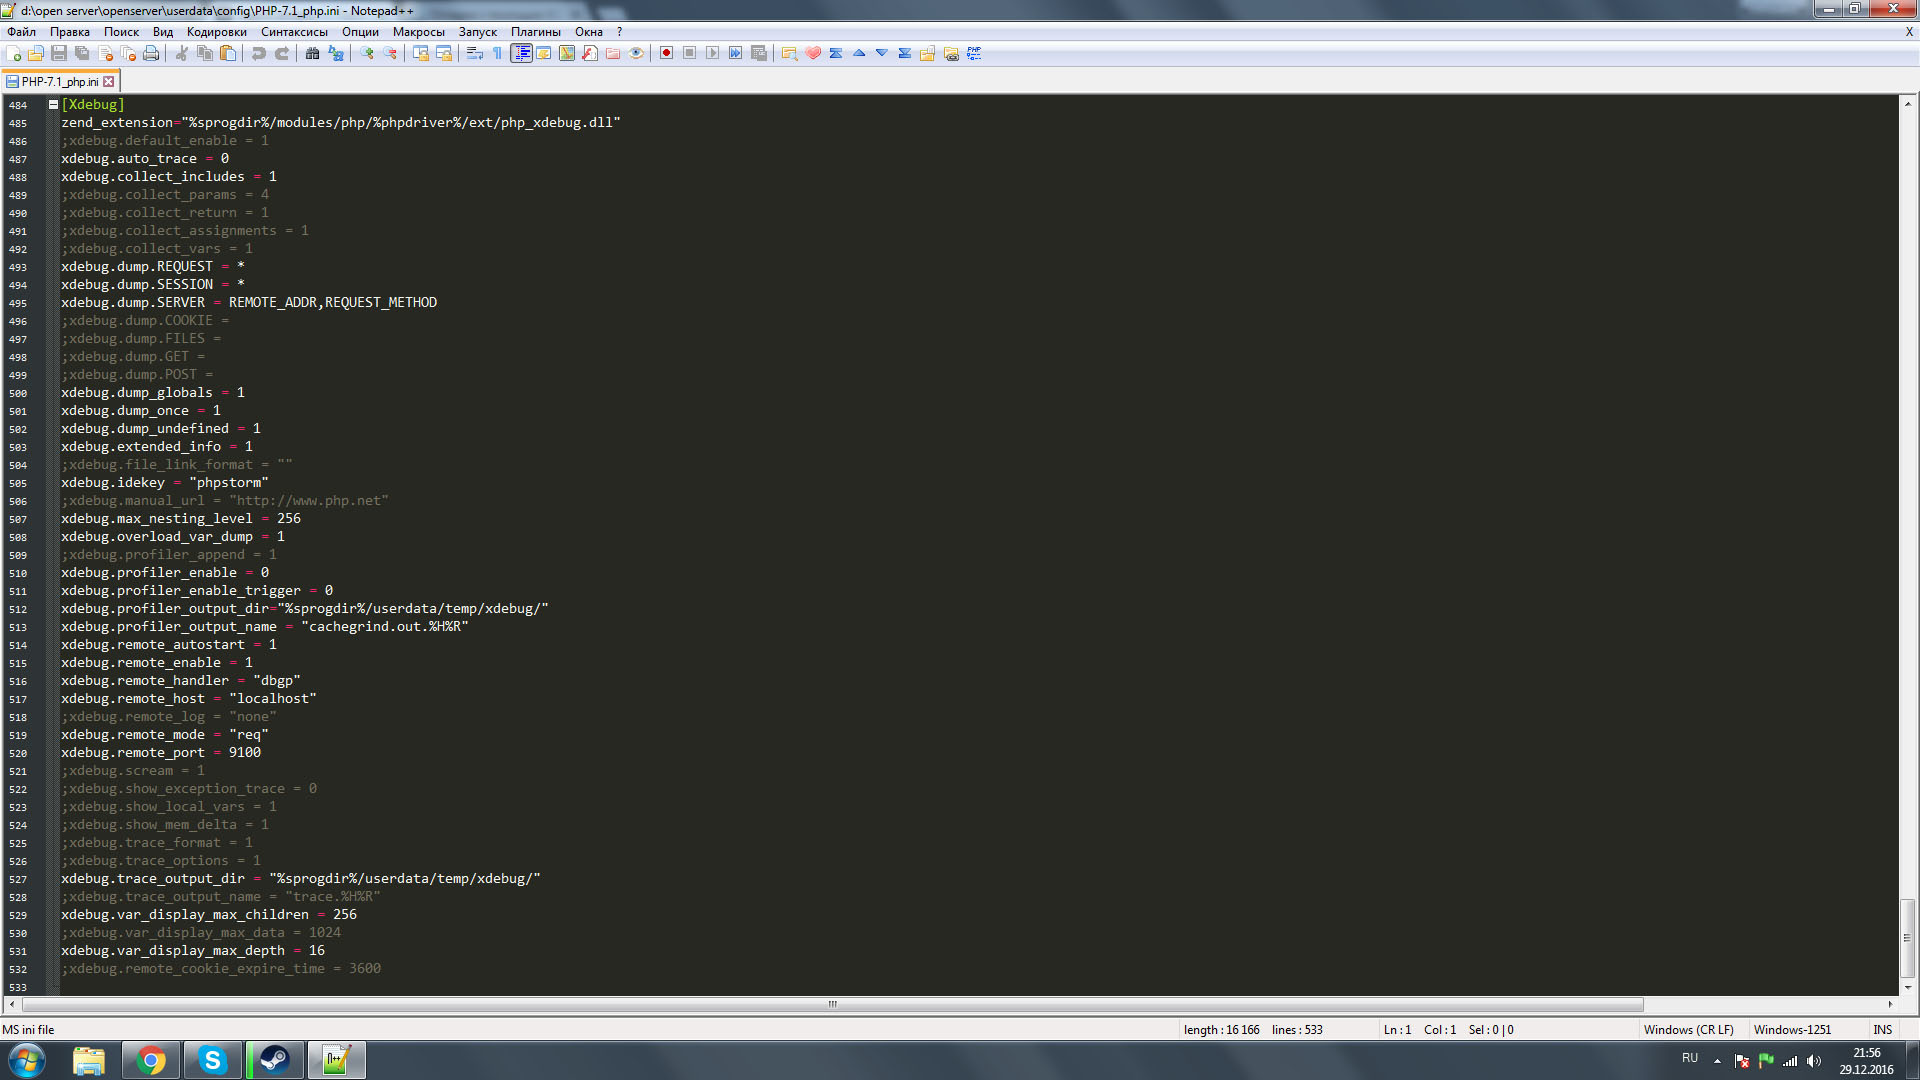
Open server 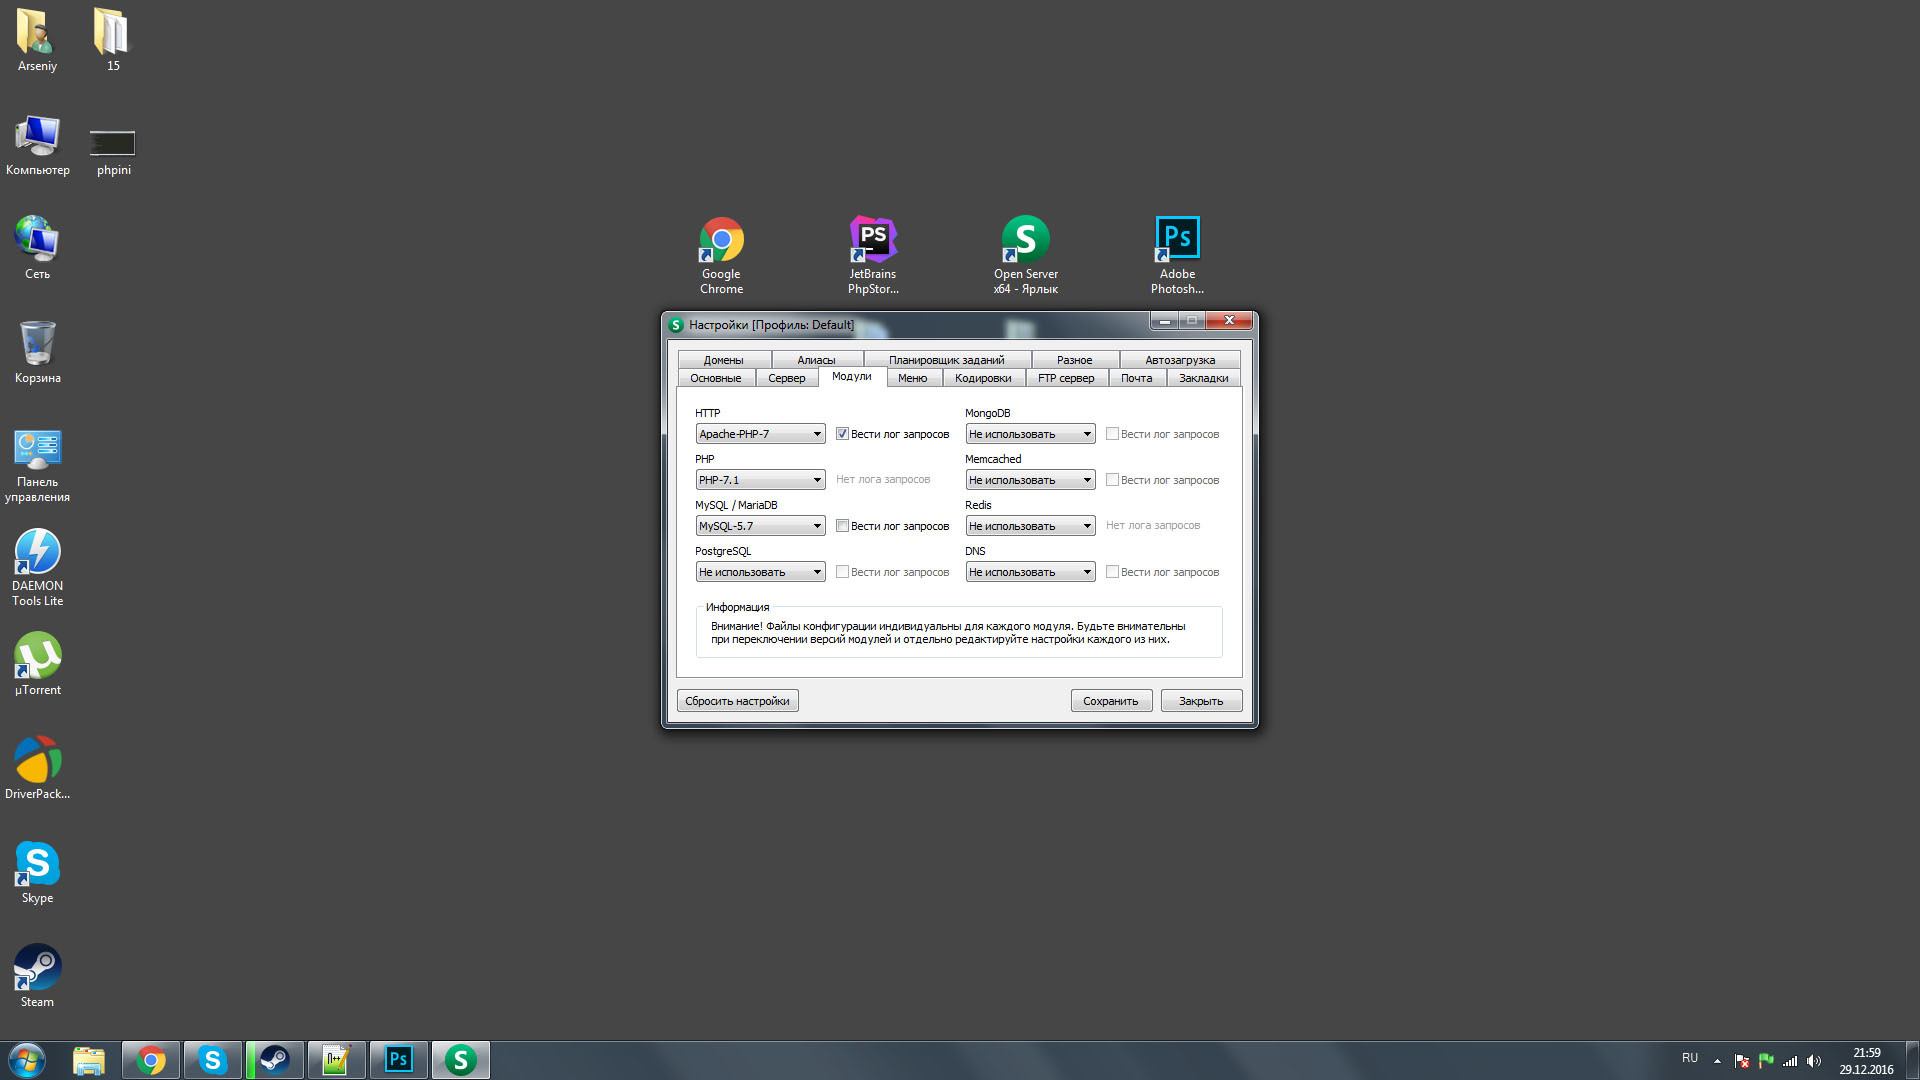
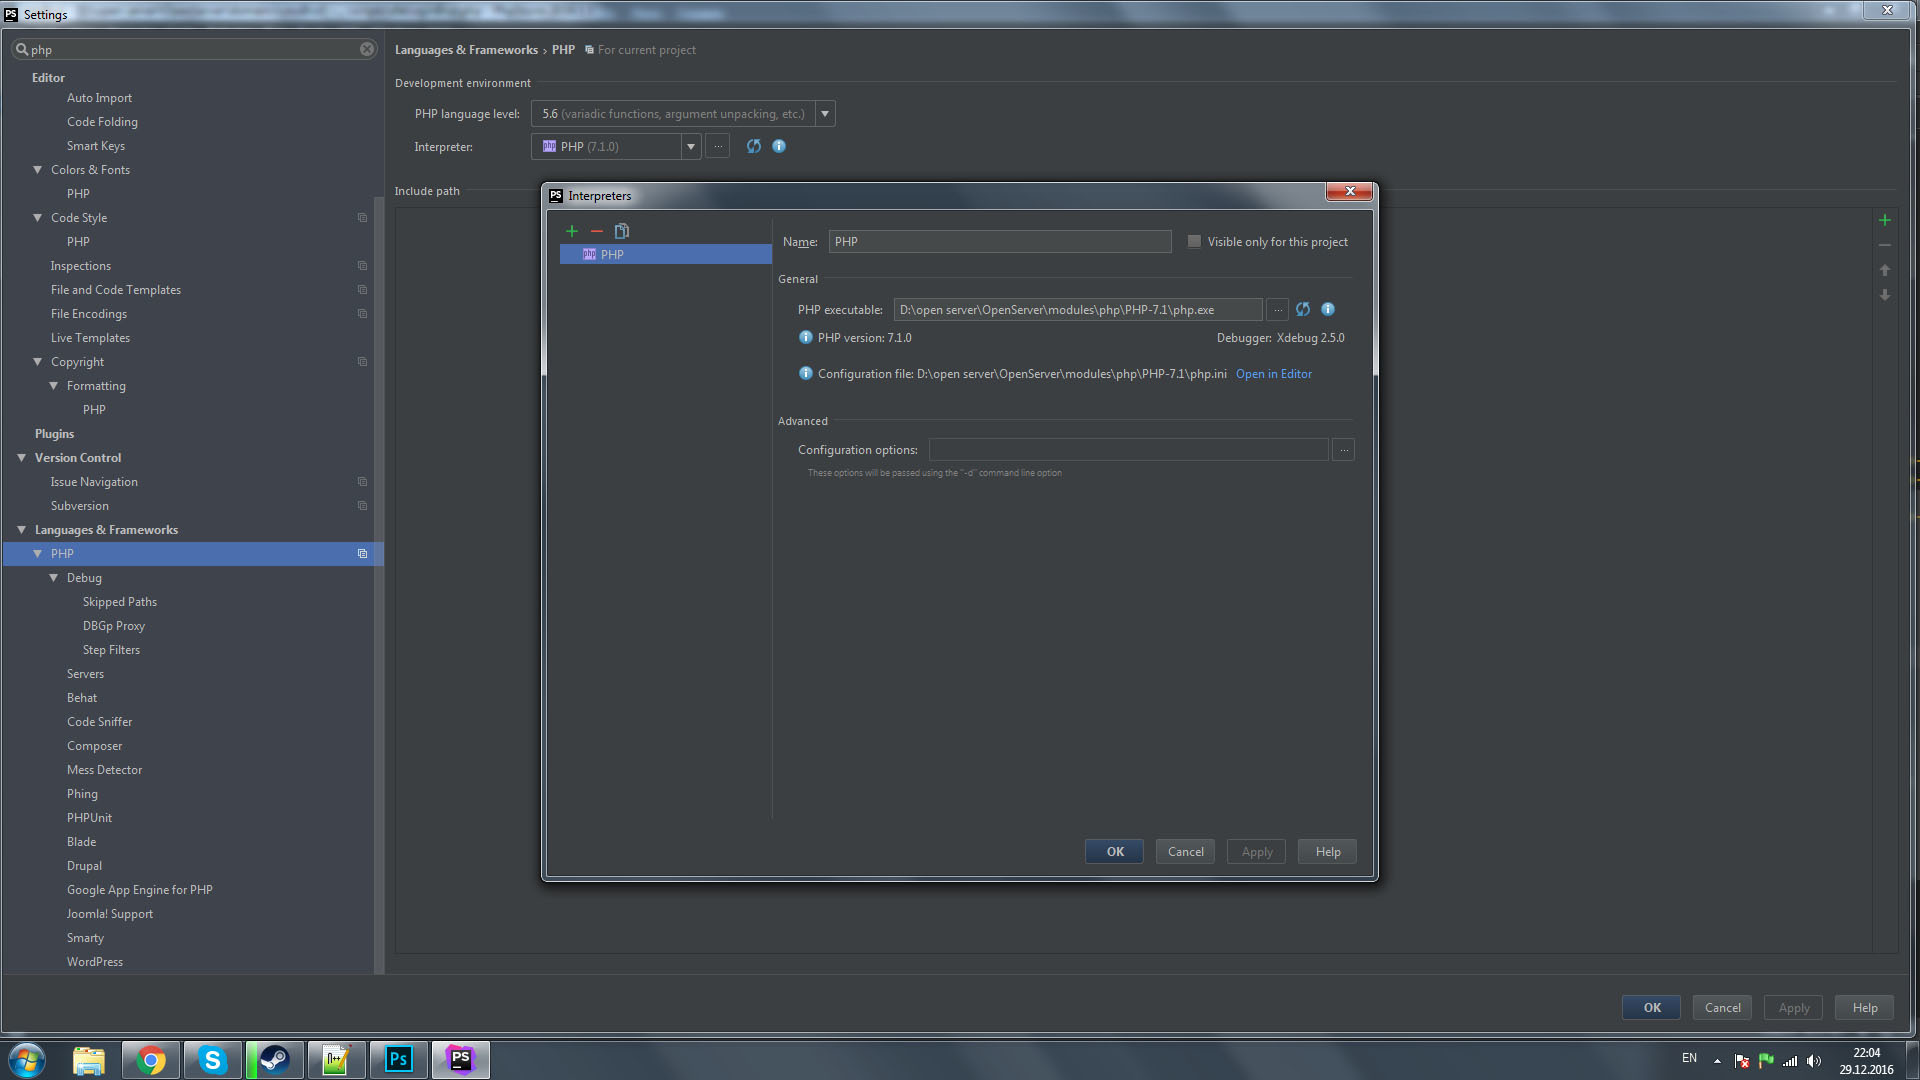
Interpreter 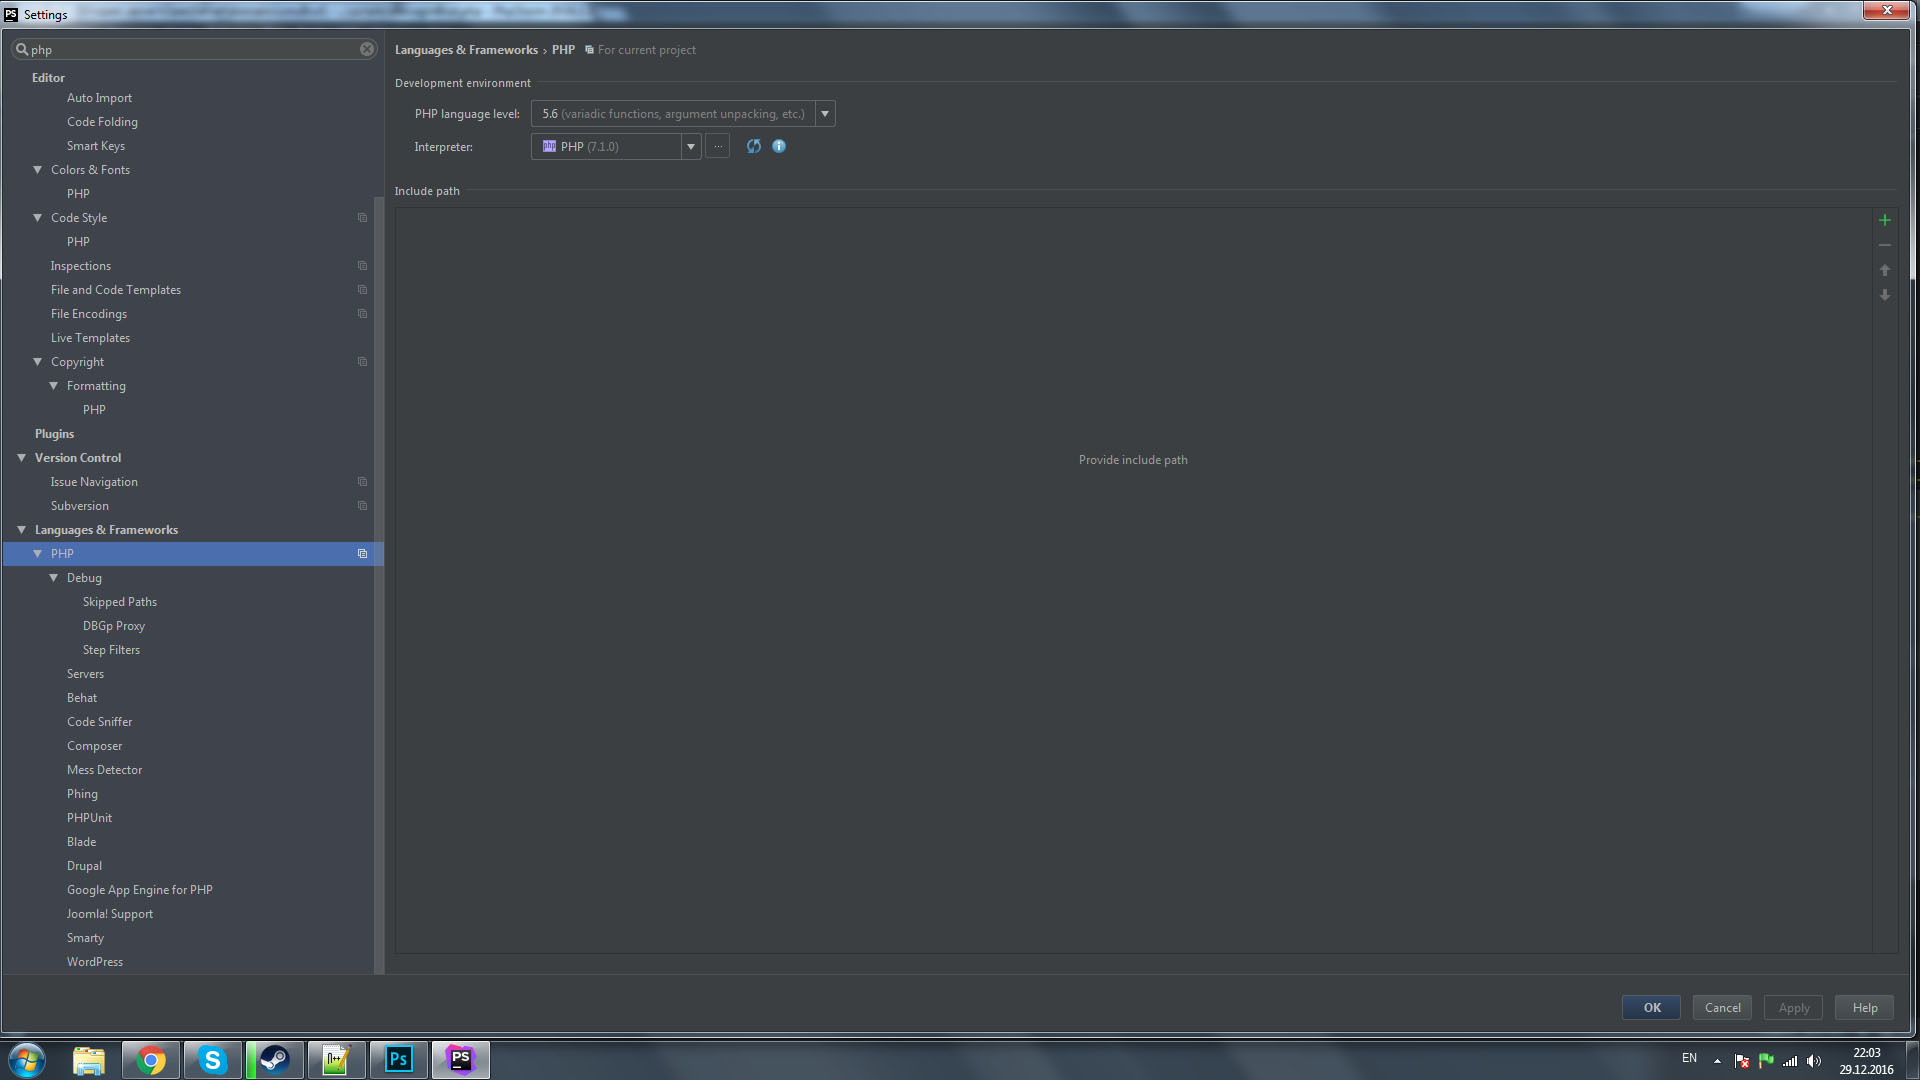
Servers 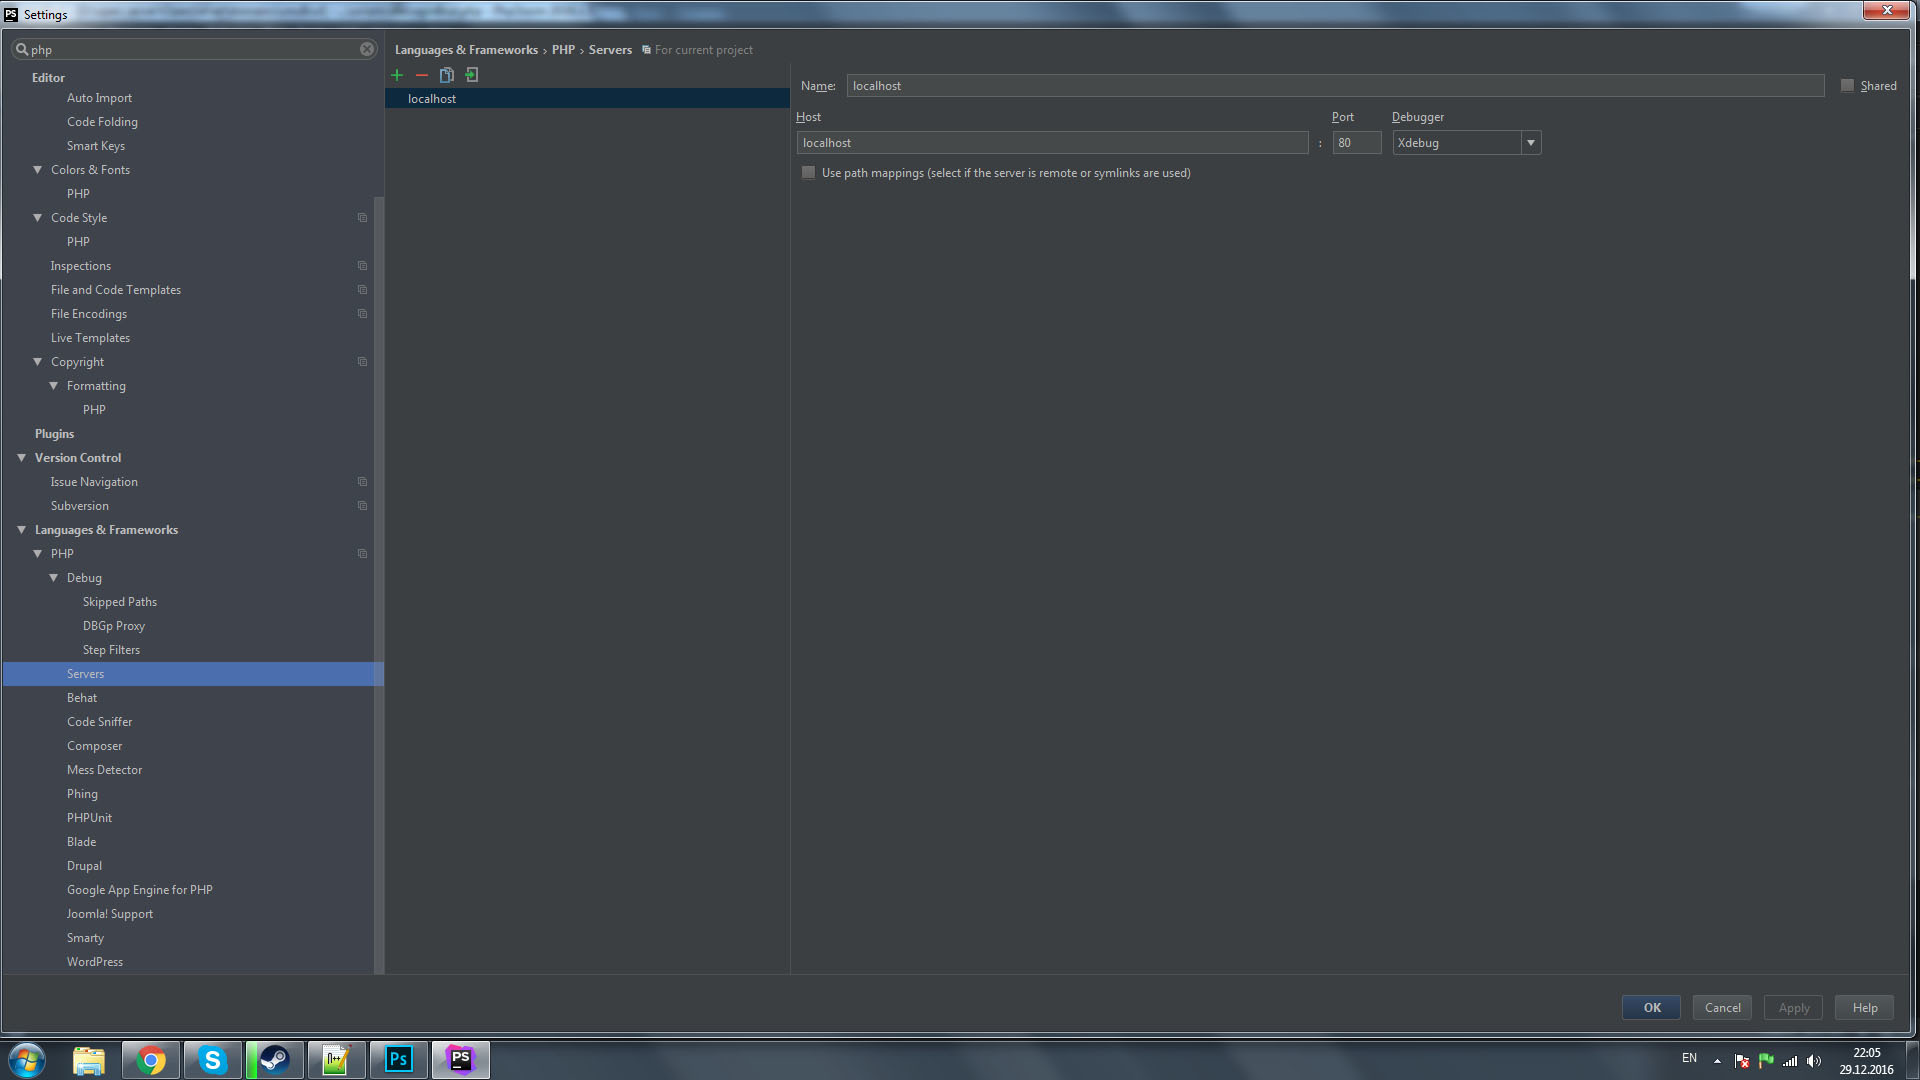
Debug 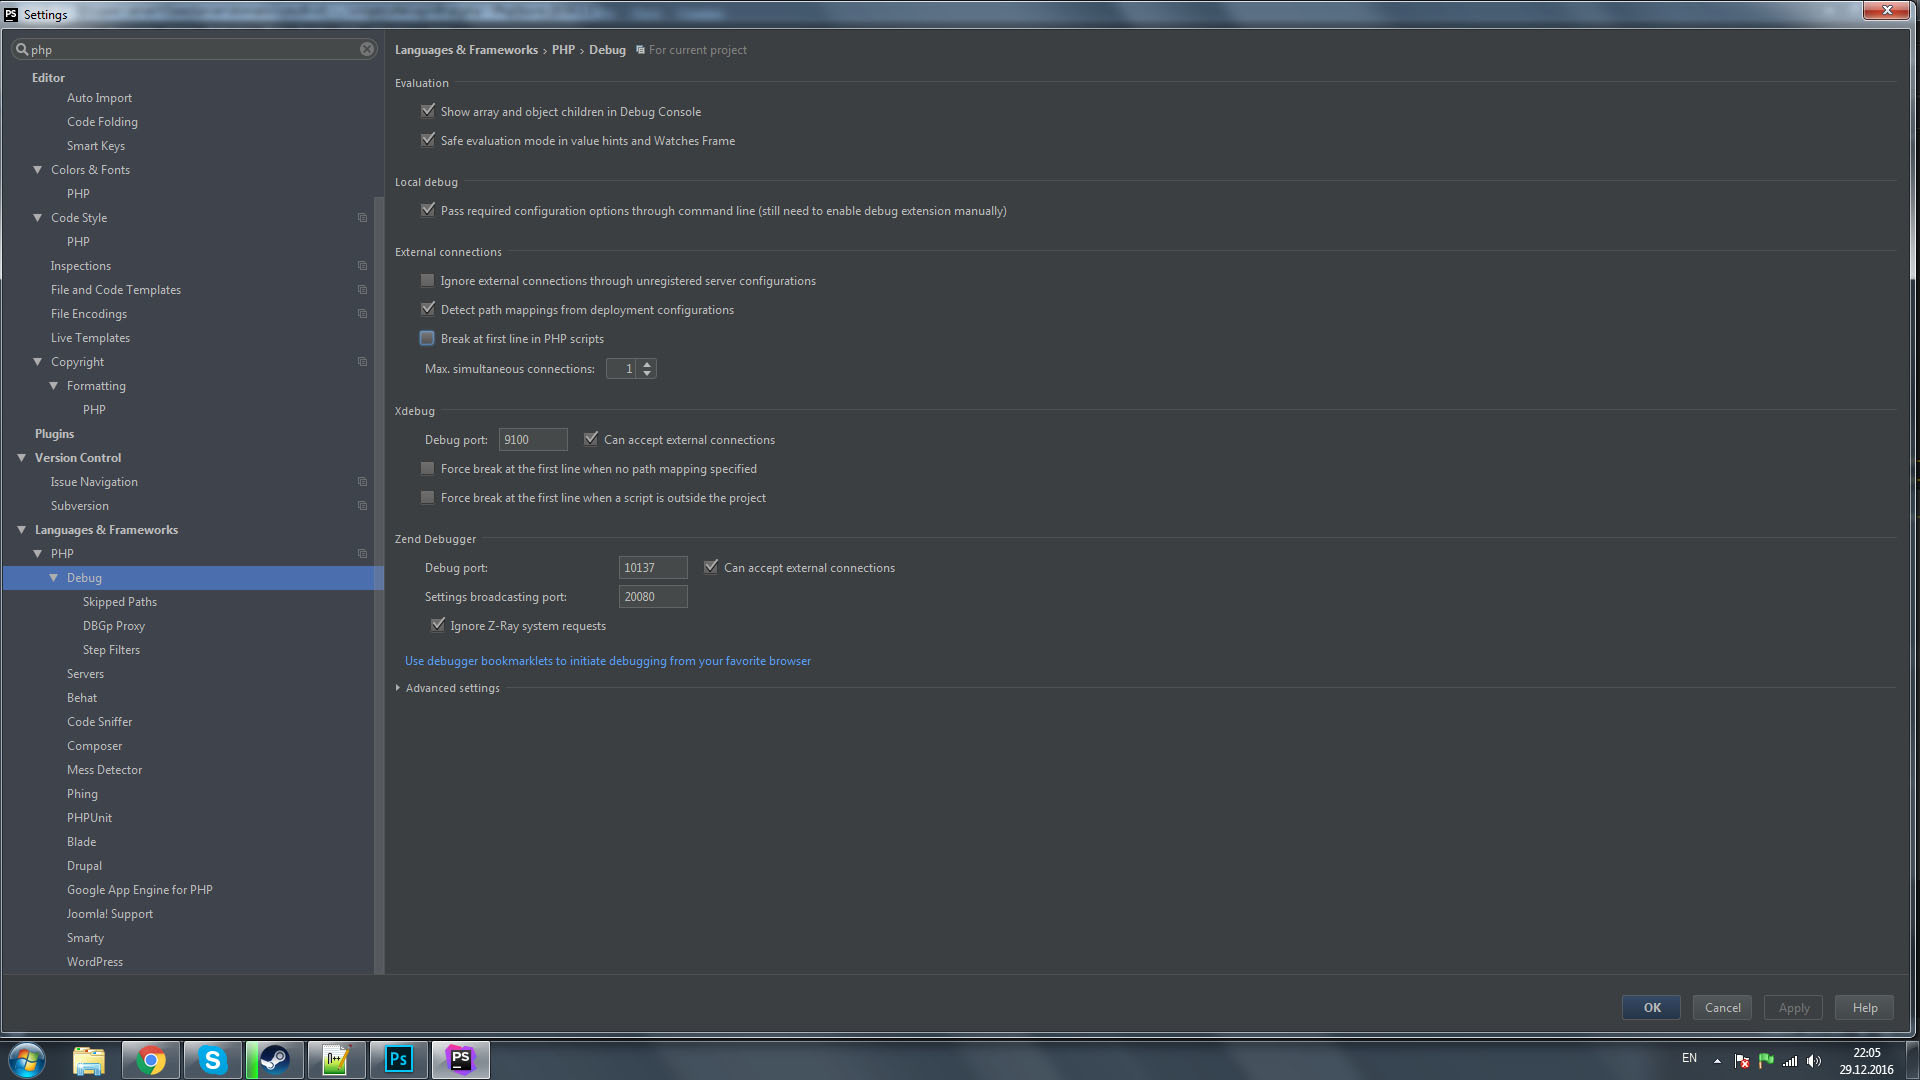
DBGp Proxy 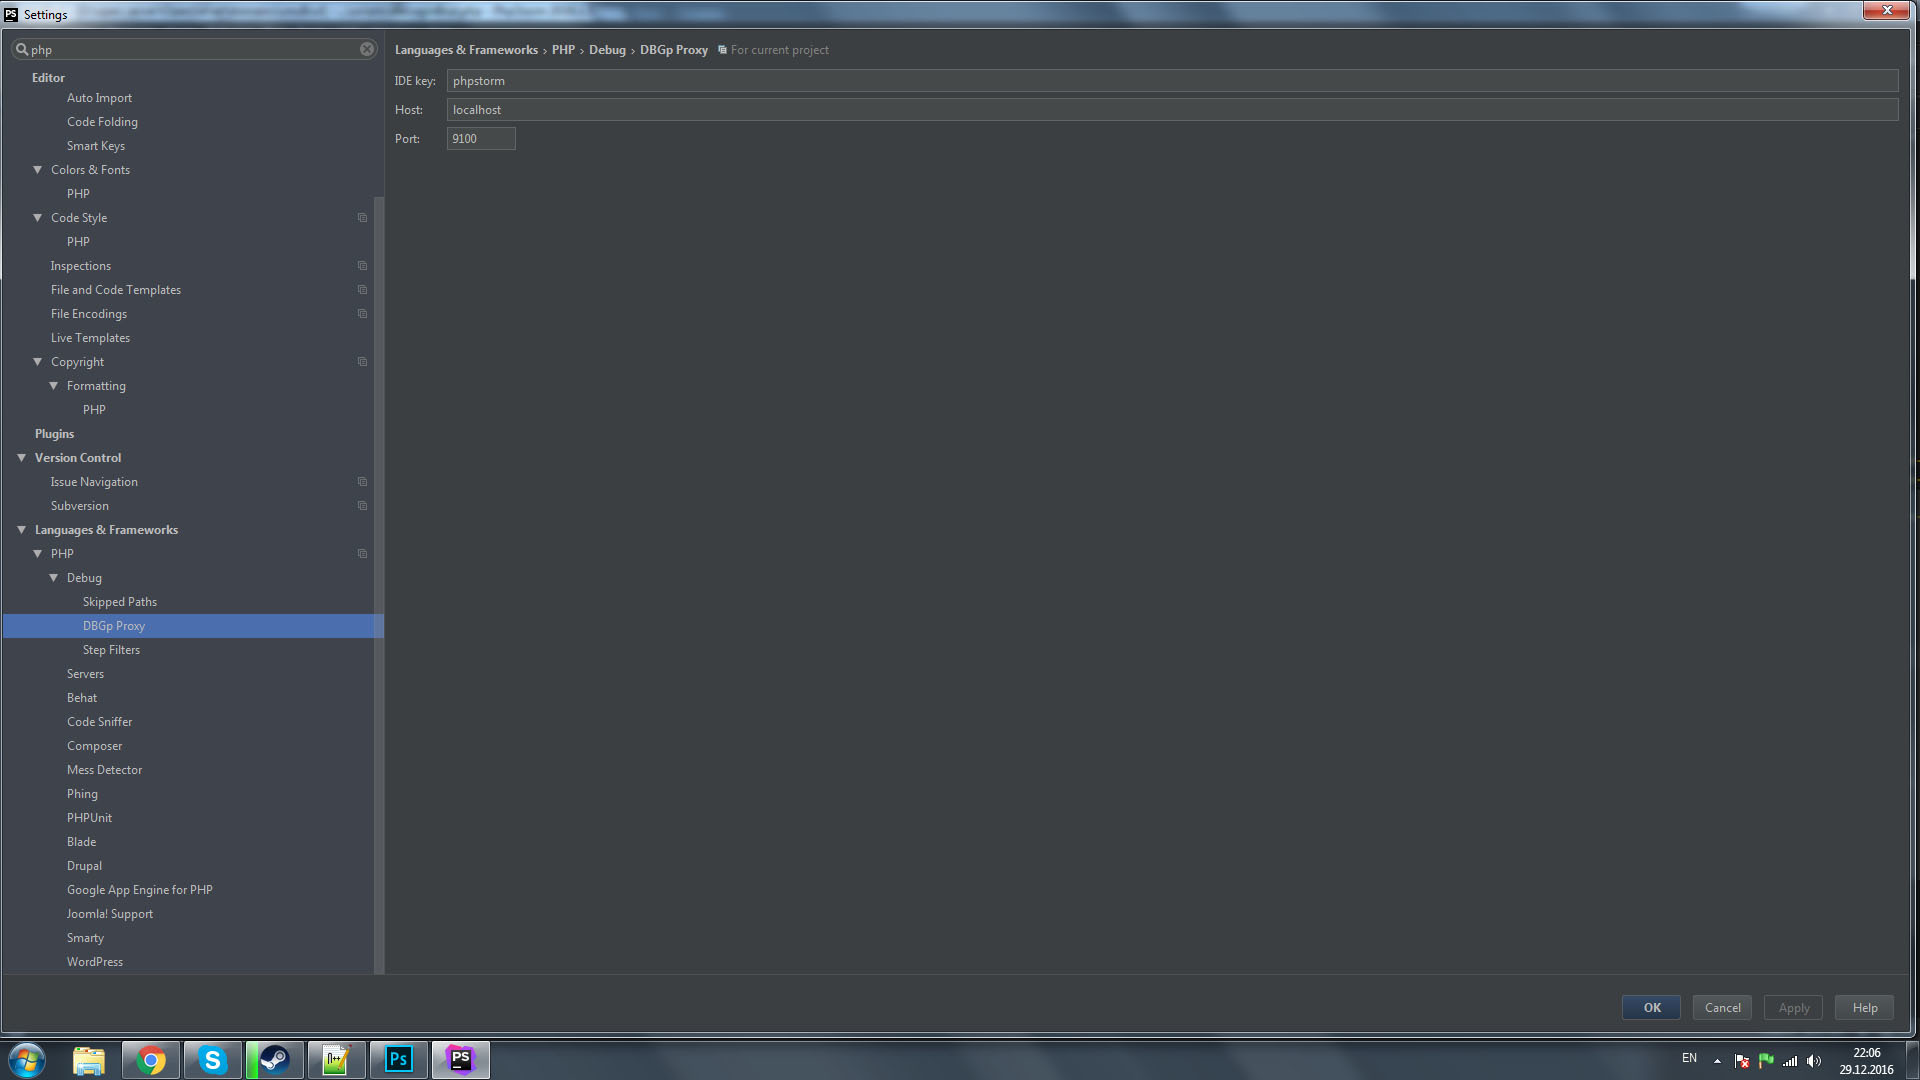
Debug config 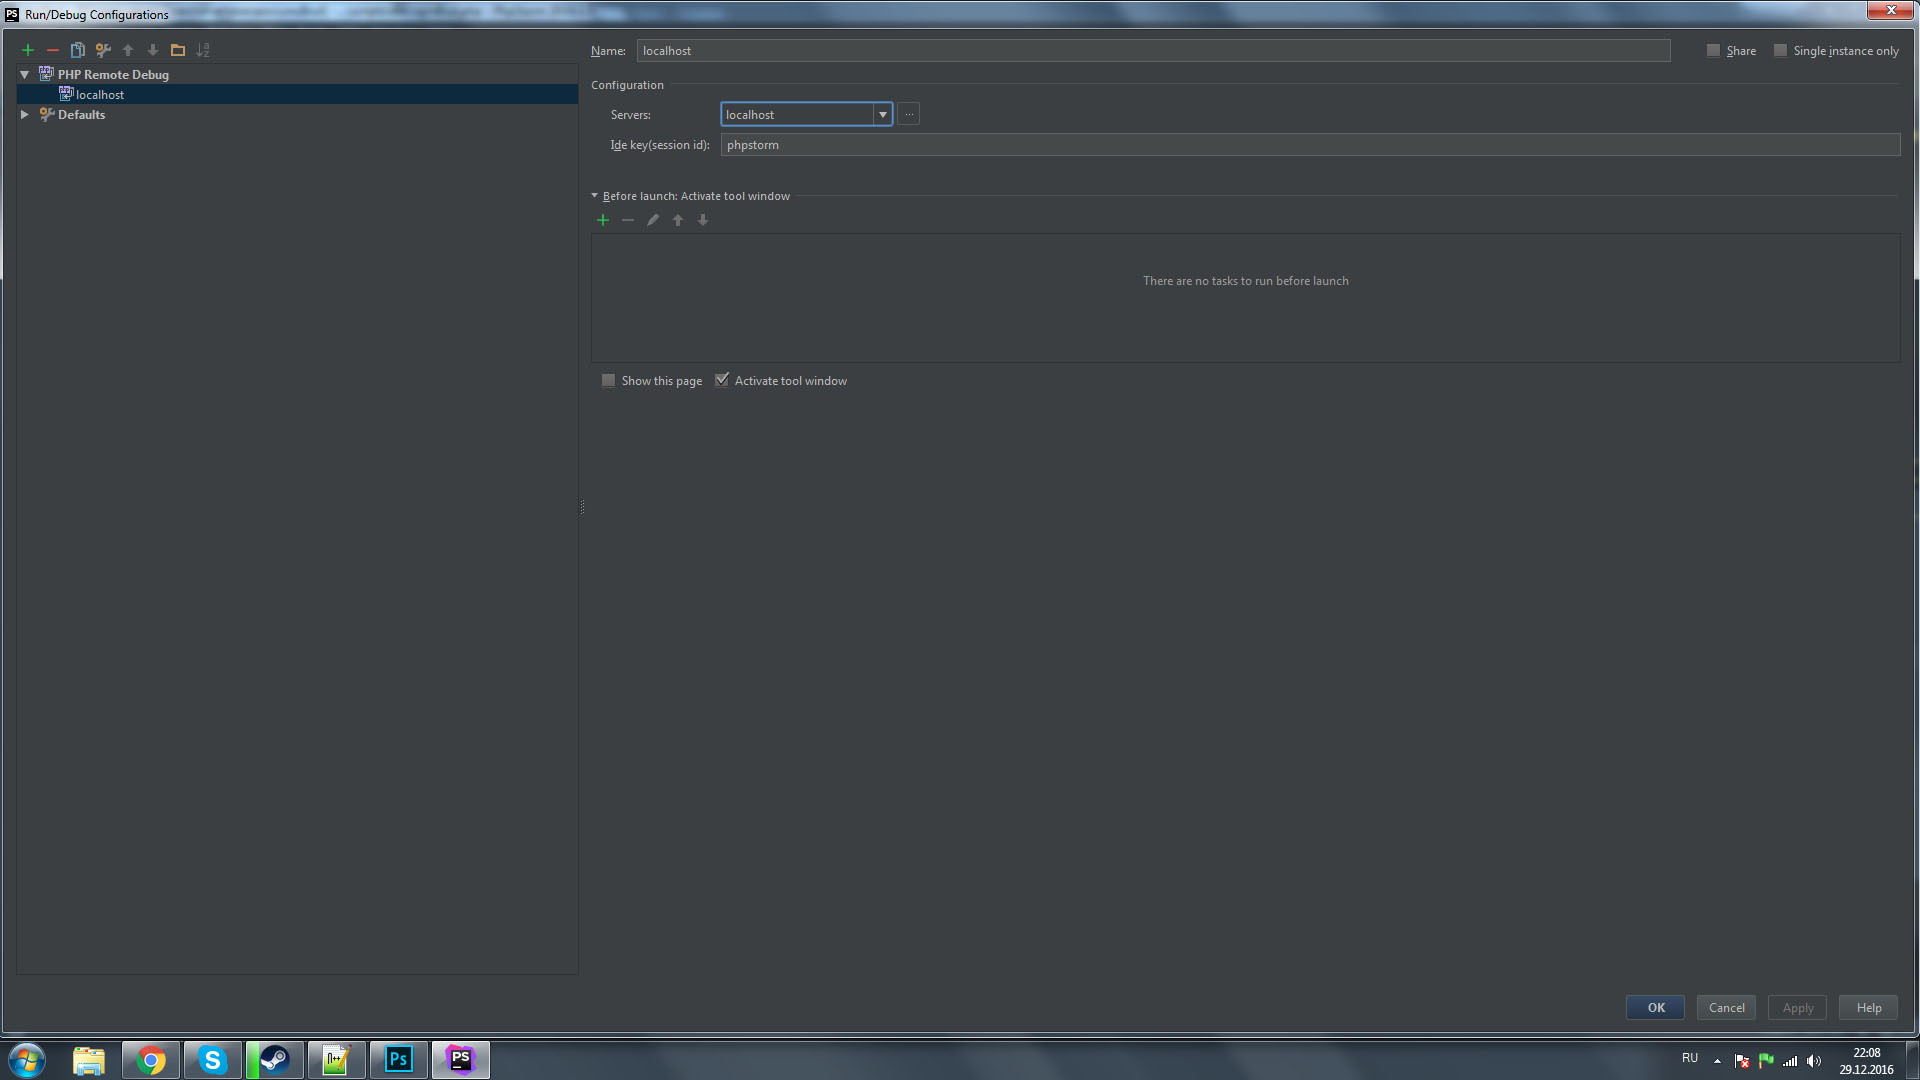
After I set a breakpoint, I start debugging and refresh the page in the browser, in the window where the values of the variables should be shown, it says "waiting for incoming connection with ide key 'phpstorm'".
Previously set up on this lesson and everything worked.
Answer the question
In order to leave comments, you need to log in
Waiting for the key to the ide. Write the debug key to the ide and to the ide itself
https://www.jetbrains.com/phpstorm/marklets/ - click "Generate", drag "Start debugger" and "Stop debugger" in the bookmarks bar, click start on the page where you run the script, while listening for the connection debugger must already be enabled, and also "Debug" must be running
Didn't find what you were looking for?
Ask your questionAsk a Question
731 491 924 answers to any question