Answer the question
In order to leave comments, you need to log in
Answer the question
In order to leave comments, you need to log in
What version of Google Charts are you using?
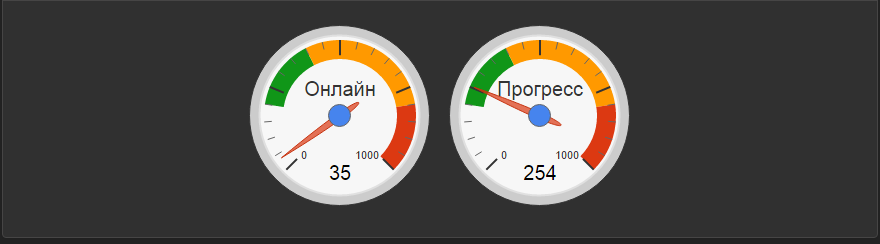
If the second, then you need to actually form a table with data like this:
{
"containerId":"chart",
"dataTable":{
  "cols":[{"label":"A","type":"string"},{"label":"B","type":"number"}],
  "rows":[{"c":[{"v":"Online"},{"v":100}]}]
},
...
}http://charts.hohli.com/new/embed.html?created=1459573342411#w=640&h=480&d={"containerId":"chart","dataTable":{"cols":[{"label":"A","type":"string"},{"label":"B","type":"number"}],"rows":[{"c":[{"v":"Online"},{"v":100}]}]},"options":{"hAxis":{"useFormatFromData":true,"viewWindow":{"max":null,"min":null},"minValue":null,"maxValue":null},"vAxes":[{"useFormatFromData":true,"viewWindow":{"max":null,"min":null},"minValue":null,"maxValue":null},{"useFormatFromData":true,"viewWindow":{"max":null,"min":null},"minValue":null,"maxValue":null}],"booleanRole":"certainty","width":600,"height":371,"min":0,"max":1000,"greenFrom":200,"greenTo":400,"yellowFrom":400,"yellowTo":800,"redFrom":800,"redTo":1000},"state":{},"view":{},"isDefaultVisualization":false,"chartType":"Gauge"}Didn't find what you were looking for?
Ask your questionAsk a Question
731 491 924 answers to any question