Answer the question
In order to leave comments, you need to log in
How to properly display charts in Grafana?
There is a graph of CPU metrics. They are collected from different hosts (implemented as variables with the possibility of multiple selection). How to make the data on the Y-axis correlate with the collected data?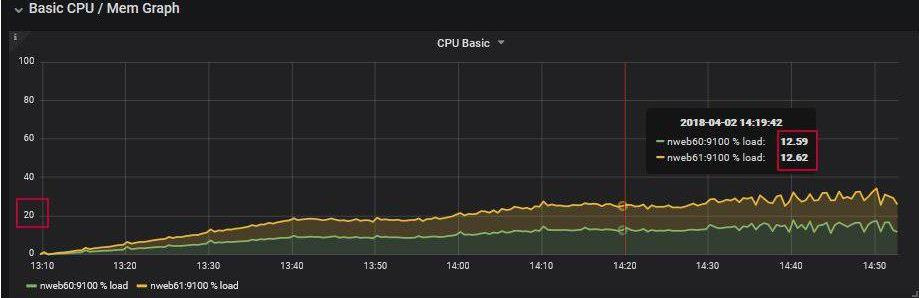
Answer the question
In order to leave comments, you need to log in
Didn't find what you were looking for?
Ask your questionAsk a Question
731 491 924 answers to any question