Answer the question
In order to leave comments, you need to log in
How to plot Maxwell's resultant equation?
Here are the graphs: 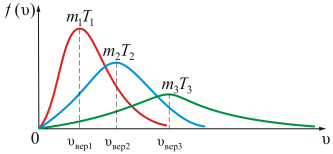
The equation itself: 
I realized that the top point of the graph is the most probable speed of the molecules. But how to find it and how to find other speeds? Just plug them into the f(v) equation and compare to get the highest score?
Answer the question
In order to leave comments, you need to log in
I realized that the top point of the graph is the most likely speed of the molecules. But how do you find it...
Didn't find what you were looking for?
Ask your questionAsk a Question
731 491 924 answers to any question