Answer the question
In order to leave comments, you need to log in
How to plot a general cpu util graph across all hosts?
Hello. Zabbix 5.0. Templated agents are active on hosts. Hosts 123pcs.
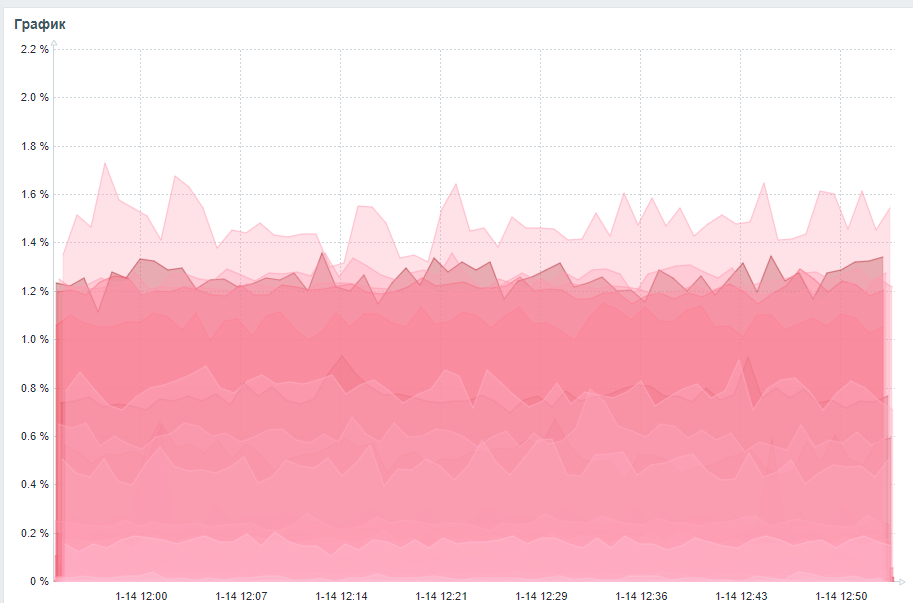
When I display the general "Graph", then this is drawn with the display of 20 out of 42 hosts.

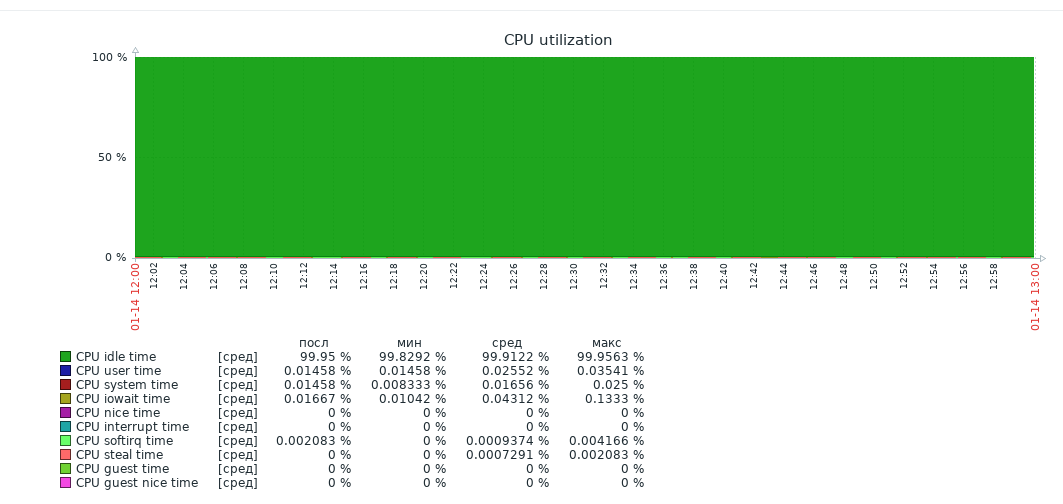
If you add "Graph (classic)", then the legend is the one you need, but the graph is displayed only for 1 node.

How to display a classic graph with avg/min/max cpu utilization for a group of nodes?
Here is a graph, only for all 123 hosts.

Answer the question
In order to leave comments, you need to log in
Didn't find what you were looking for?
Ask your questionAsk a Question
731 491 924 answers to any question