Answer the question
In order to leave comments, you need to log in
How to place a canvas object in a new window next to a table?
The task is this:
You need to create a page on which trigonometric values \u200b\u200bare entered with a range and a step. Further, a label with these values should be created in a new window of the following form: 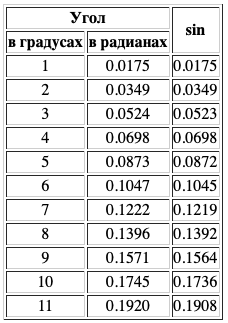
A new window must be created by the open () method.
Also, in a new window next to the plate, you need to display the graph of this function in the specified range. I'm going to draw a graph using canvas. But I don't understand how to put it in a new window. Here is a link to what happened:
PS In the JS code there is a function drawBack () where the coordinate plane is drawn. How, for example, to place it in a new window next to the table?
Answer the question
In order to leave comments, you need to log in
Didn't find what you were looking for?
Ask your questionAsk a Question
731 491 924 answers to any question