Answer the question
In order to leave comments, you need to log in
How to monitor mysql health with zabbix?
How to properly monitor the performance of mysql?
Zabbix has a built-in template for this, but there are some problems with it.
It shows uptime, status, various other parameters, but at some point on the request per second graph, we see a gap of more than an hour of time (see figure) 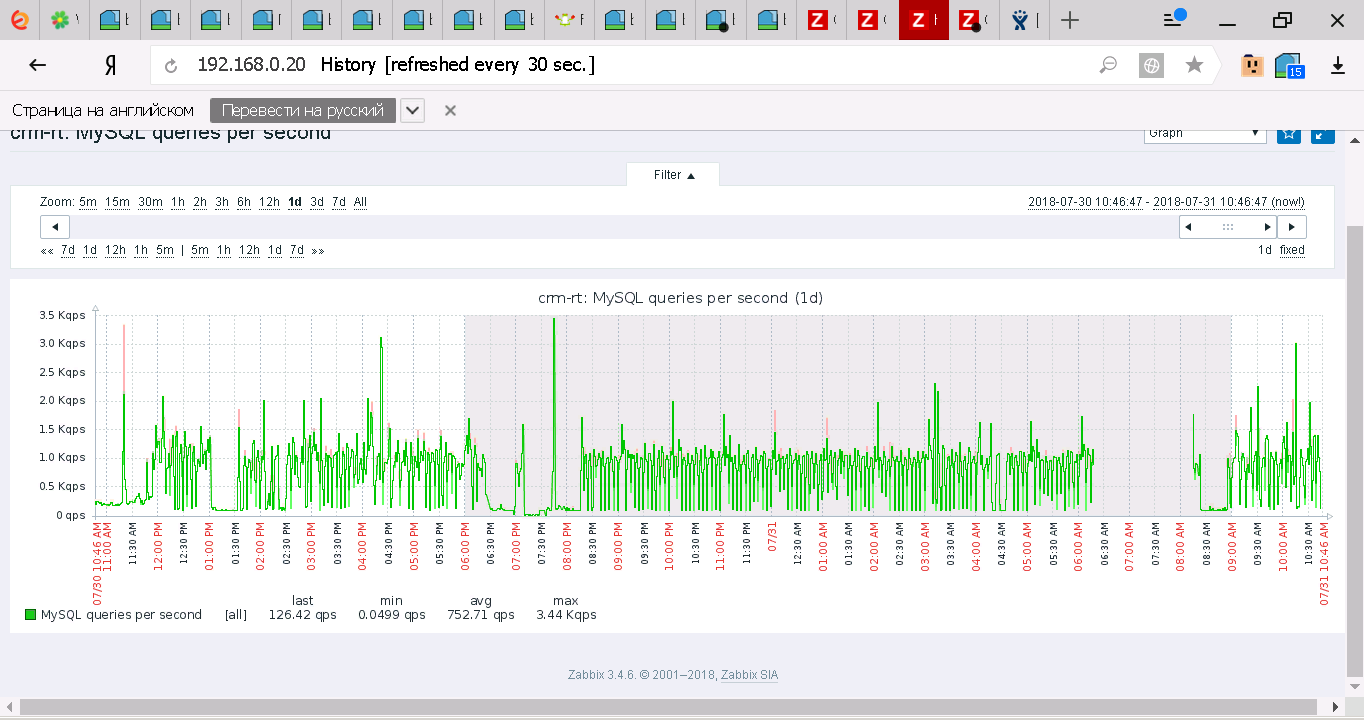 .
.
You can, of course, build a trigger for a small number of requests, but this is not quite the same.
How do you check that mysql is not only running but is also processing queries?
Answer the question
In order to leave comments, you need to log in
You need to put a nodata () trigger on these requests, you never know why you lost data - were they, in particular.
This is not a template issue, this is a Zabbix server issue. Understand why data is lost.
It is not clear why this should be monitored at all, it is not easier to monitor the operation of an application that accesses MySQL, and trigger if it does not work, and this statistics is useful for investigating incidents
Didn't find what you were looking for?
Ask your questionAsk a Question
731 491 924 answers to any question