Answer the question
In order to leave comments, you need to log in
How to make custom tooltip in highchart?
Hello. I want to make a tooltip like in the picture 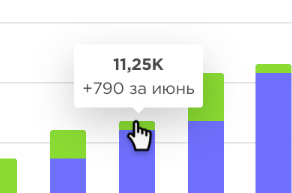
But now it's like this 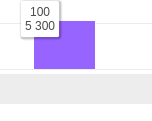
But I can't find the info in the dock. How to do like on the first screen? Now I have this api -
import colors from '../../utils/colorsCharts';

const ColumnChart = ({ rawData }) => ({
  chart: {
    type: 'column',
    spacingBottom: 5,
    spacingLeft: 0,
    spacingRight: 5,
    spacingTop: 10,
    height: 200,
  },
  title: false,
  subtitle: false,
  legend: false,
  credits: false,
  xAxis: {
    visible: false,
    categories: rawData.map(item => item[0]),
    gridLineColor: 'rgba(74,74,74,0.1)',
    gridLineWidth: 1,
    tickWidth: 0,
    endOnTick: false,
  },
  yAxis: {
    title: {
      text: null,
    },
    startOnTick: true,
    gridLineWidth: 1,
    gridLineColor: 'rgba(74,74,74,0.1)',
    lineWidth: 1,
    lineColor: '#e6e6e6',
    tickWidth: 0,
    showFirstLabel: true,
  },
  tooltip: {
    backgroundColor: '#fff',
    borderWidth: 0,
    borderRadius: 3,
    headerFormat: '<div style="display: flex; flex-direction: column; align-items: center;">',
    pointFormat: '<div>{point.y}</div>',
    footerFormat: '</div>',
    style: {
      color: '#4a4a4a',
    },
    padding: 4,
    shared: true,
    useHTML: true,
  },
  plotOptions: {
    column: {
      stacking: 'normal',
    },
    borderRadius: 3,
  },
  series: [{
    data: rawData.map(item => item[2]),
    color: colors[1],
  },
  {
    data: rawData.map(item => item[1]),
    color: colors[0],
  }],
});

export default ColumnChart;['11', 2500, 100],Answer the question
In order to leave comments, you need to log in
Didn't find what you were looking for?
Ask your questionAsk a Question
731 491 924 answers to any question