Answer the question
In order to leave comments, you need to log in
How to generate numbers with linearly given probability?
Hello.
There is a task to generate numbers in the given range . Moreover, the probability of the appearance of numbers is given, it is not the same.
I will give an example of calling the desired function:
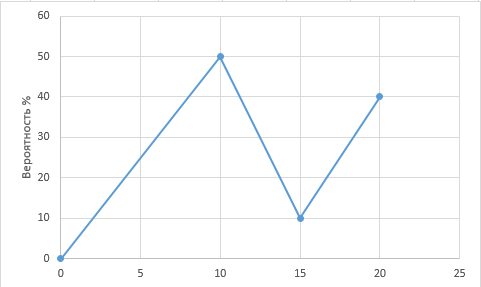
Here the range of numbers to generate is from 0 to 20 . Spawn chance 0 - 0%.
10 - 50%, 15 - 10%, 20 - 40%.
Accordingly, for example, the number 5 will appear with a 25% probability, the number 1 with a 5% probability, and so on. The number of pairs of values at the input to the function can be any, the range is also any. The generated numbers do not have to be integers.
How to implement such a function? Maybe there are ready-made implementations?random()
PS In the comments, they rightly suggested that the sum of the probabilities on my chart would be more than 100%, which is impossible. Therefore, we can assume that not probability percentages are indicated, but probability units.
Answer the question
In order to leave comments, you need to log in
Divide your function by the area below it and get the probability density , take the density integral (not hard for a linear function) and get the distribution function .
Construct the inverse function of the distribution function, generate a number uniformly distributed from 0 to 1 and calculate the value of the resulting function.
If the parameters set the probability discretely (in the picture, by the way, you don’t have discretely, but complex nonlinear dependencies, i.e. 1 occurs almost 50 times less often than 10, I dare to assume that you don’t need SO) on intervals, such as from [0-10) - 50 then solve the problem head-on, first choose the interval according to the probabilities (if you set it quantitatively, then this is the sum of the given values \u200b\u200b- the maximum value, and the rand value interval is the corresponding value for the sum up to this interval and with it, after choosing the interval, just repeat rand because within the interval you need uniform.
Didn't find what you were looking for?
Ask your questionAsk a Question
731 491 924 answers to any question