Answer the question
In order to leave comments, you need to log in
How to change coordinate grid in ggplot2 package in R language?
I build a coordinate grid on the graph using the function coord_cartesian(), but I don’t know how to change the number of sections on a particular axis. It seems to be possible with the help of xaxp, yaxp, but either I'm doing something wrong, or it's not intended for this. But still, how to change the number of sections?
Answer the question
In order to leave comments, you need to log in
It is not necessary to change the grid, but the number of sections of the axes.
This is a parameter breaks.
This code
ggplot(data = mtcars)+
        geom_point(aes(x=mpg,y=hp))+
theme_bw()ggplot(data = mtcars)+
geom_point(aes(x=mpg,y=hp))+
scale_x_continuous(breaks = 10:35)+
theme_bw()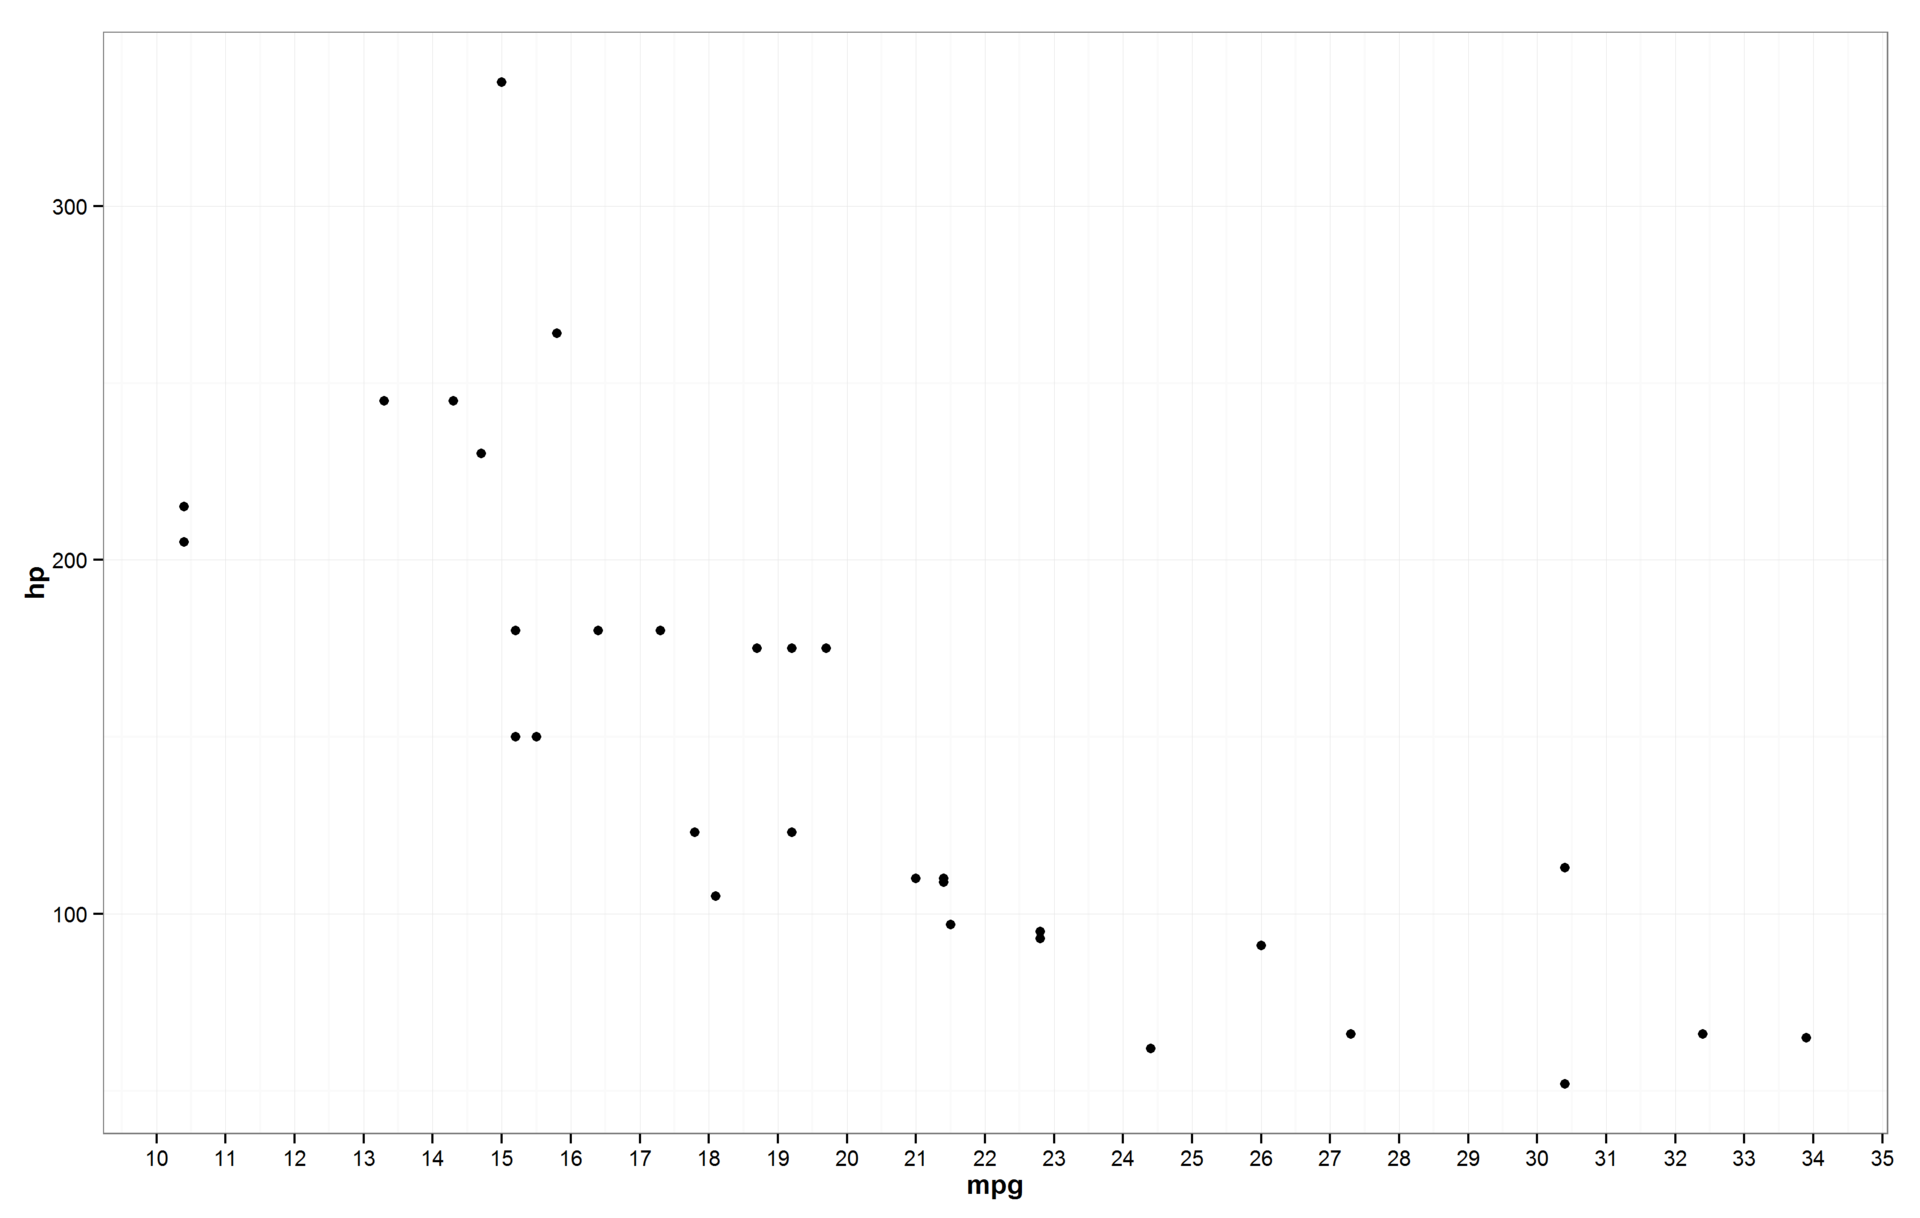
Didn't find what you were looking for?
Ask your questionAsk a Question
731 491 924 answers to any question