Answer the question
In order to leave comments, you need to log in
How to plot a binomial distribution in R?
I need to draw a binomial distribution plot with 100000 tries. The chart should consist of the line chart itself and the histogram. I do like this:
library(tidyverse)
summarize.binomial.observations <- function(trials, theta, observations) {
  sample.space <- c(1,0)
  results <- 1:observations %>%
  map_int(function(x)
    as.integer(
      sum(
        sample(sample.space, size = trials, replace = TRUE, prob = c(theta, 1 - theta))
      )
    )
  )
  return(results)
}
summary <- summarize.binomial.observations(80, 0.6, 5000)
resulting.df <- data.frame(flips <- summary) # ggplot only works with data frames
names(resulting.df) <- c("flips")
#binPDF <- data.frame(x<-1:80, y<-dbinom(1:80, size=80, prob = 0.6))
#names(binPDF) <- c("flips", "prob")
ggplot(resulting.df) +
  geom_histogram(breaks=seq(1, 80, 2), aes(x=flips, y=..density..), position="identity",,colour = 'blue', fill = 'white') +
  geom_density(aes(x=flips, y = ..density..), colour="red")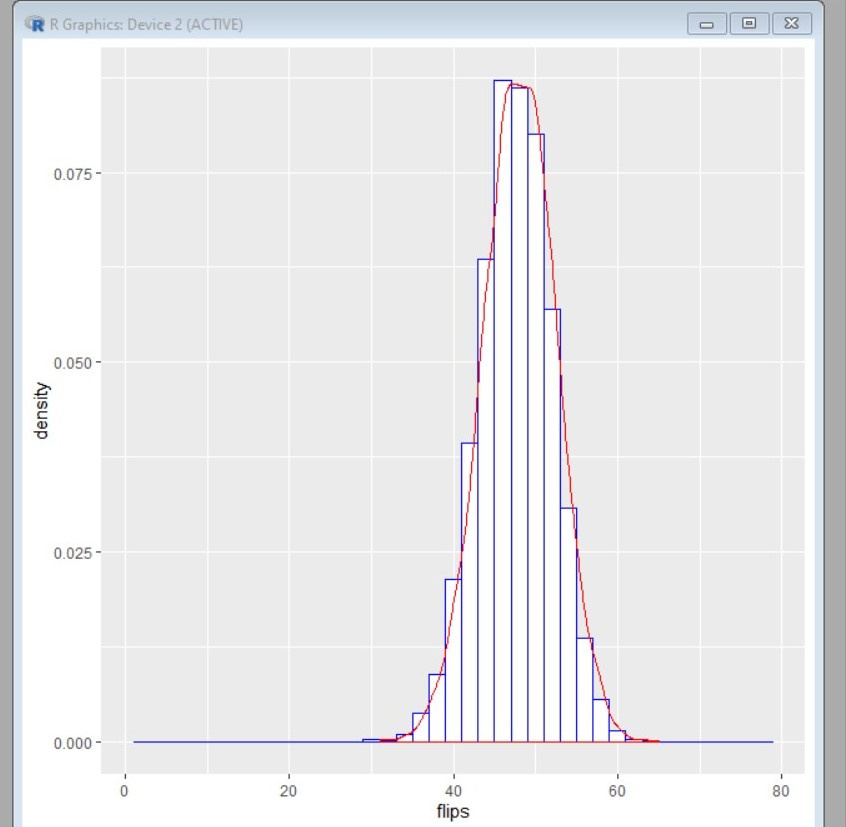
Answer the question
In order to leave comments, you need to log in
Didn't find what you were looking for?
Ask your questionAsk a Question
731 491 924 answers to any question