Answer the question
In order to leave comments, you need to log in
How to build a coverage map using a set of coordinates and a signal level value?
There is a data set in a text file, where the coordinates and other parameters are indicated.
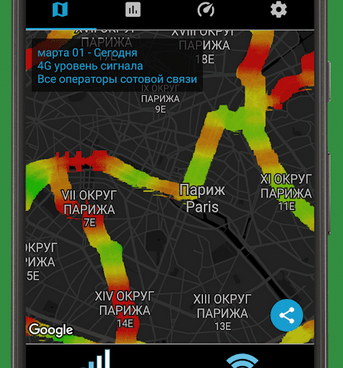
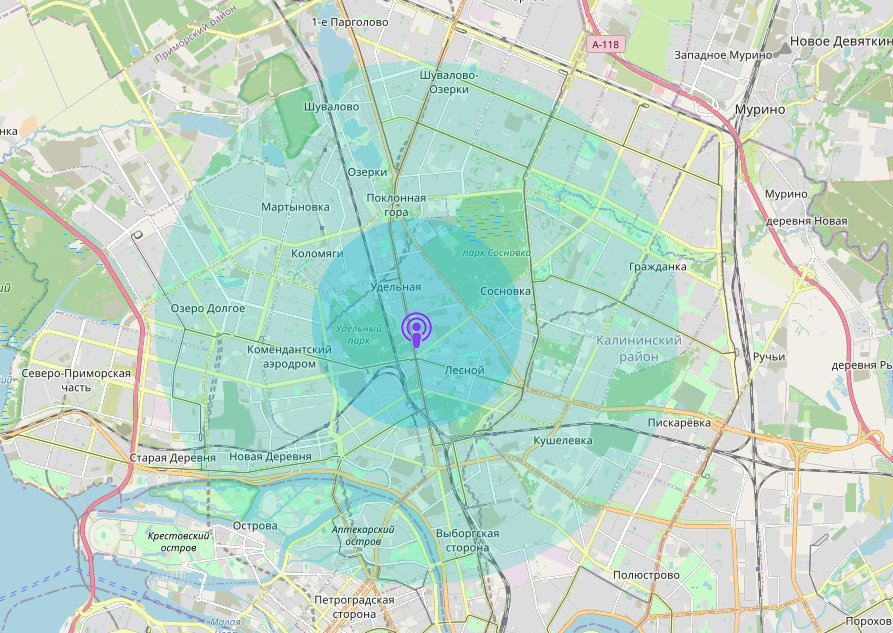
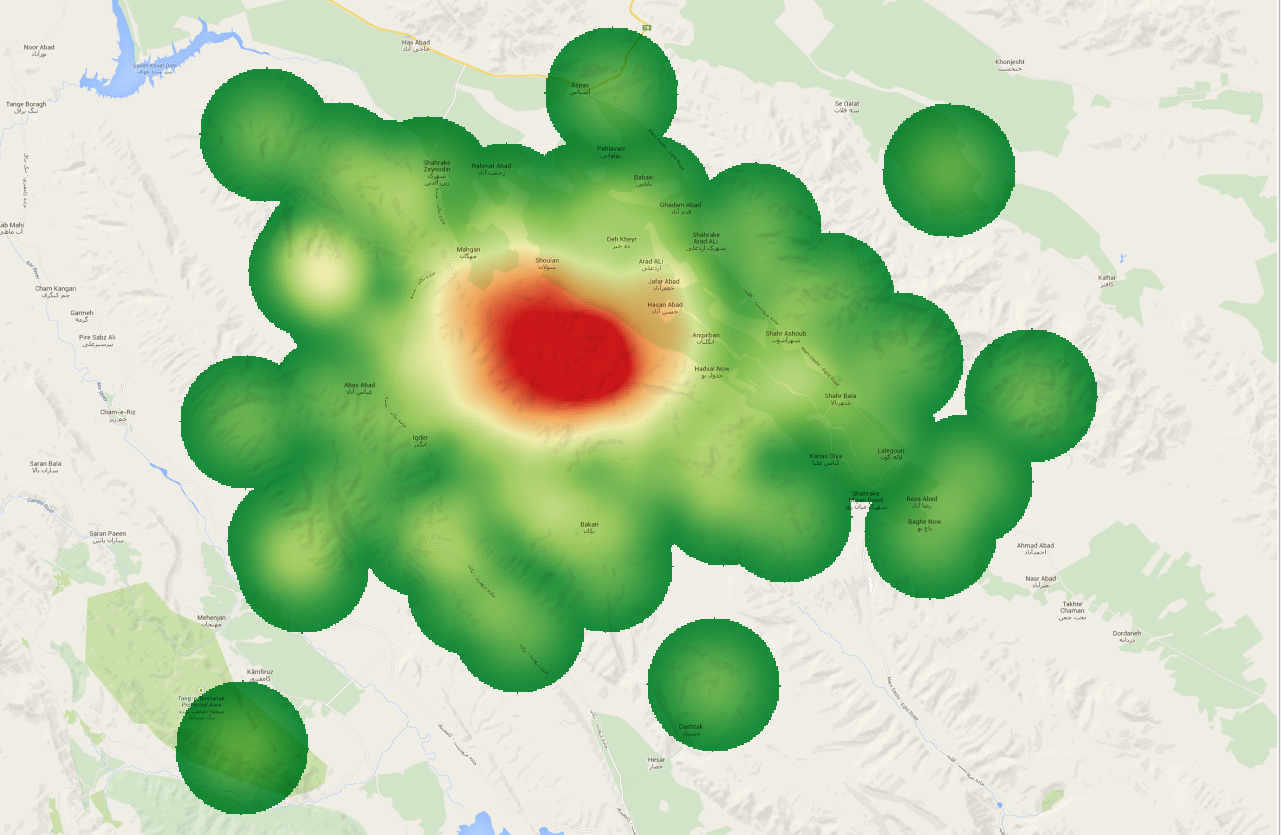
Interested in a method of visualizing this on the map. (I will give examples in the pictures below)


PS Interested in a tool for applying a heatmap from a test file.
Answer the question
In order to leave comments, you need to log in
There is a project https://github.com/Leaflet/Leaflet.heat
Attach js with data
var addressPoints = [
[-37.8839, 175.3745188667, "571"],
[-37.8869090667, 175.3657417333, "486"],
[-37.8894207167, 175.4015351167, "807"],
[-37.8927369333, 175.4087452333, "899"],
[-37.90585105, 175.4453463833, "1273"],
[-37.9064188833, 175.4441556833, "1258"],
[-37.90584715, 175.4463564333, "1279"],
]You divide the map into segments (squares). You go through all the coordinates, look in which segment, plus the value. Will it be one dimensional? array where key is segment and value is sum of all values.
Then you give a value from 0 to 1, depending on the minimum and maximum values in the array
How to map?
For your specific task - it is unlikely that there will be something ready. You need to look for something close to your task and finish it for your own.
Here are some examples to get you started:
https://www.opensourceforu.com/2021/03/plotting-ai...
https://github.com/googlemaps/google-maps-services...
https:/ /plotly.com/python/maps/
https://towardsdatascience.com/how-to-create-inter...
https://towardsdatascience.com/mapping-with-matplo...
https://geopandas.org /docs/user_guide/mapping.html
https://towardsdatascience.com/creating-beautiful-...
https://towardsdatascience.com/making-3-easy-maps-...
Didn't find what you were looking for?
Ask your questionAsk a Question
731 491 924 answers to any question