Answer the question
In order to leave comments, you need to log in
How are these cards created?
For the site of the Abinsk Electrometallurgical Plant, such a map was created.
I would like to know exactly how such graphics are created and what may be its shortcomings. 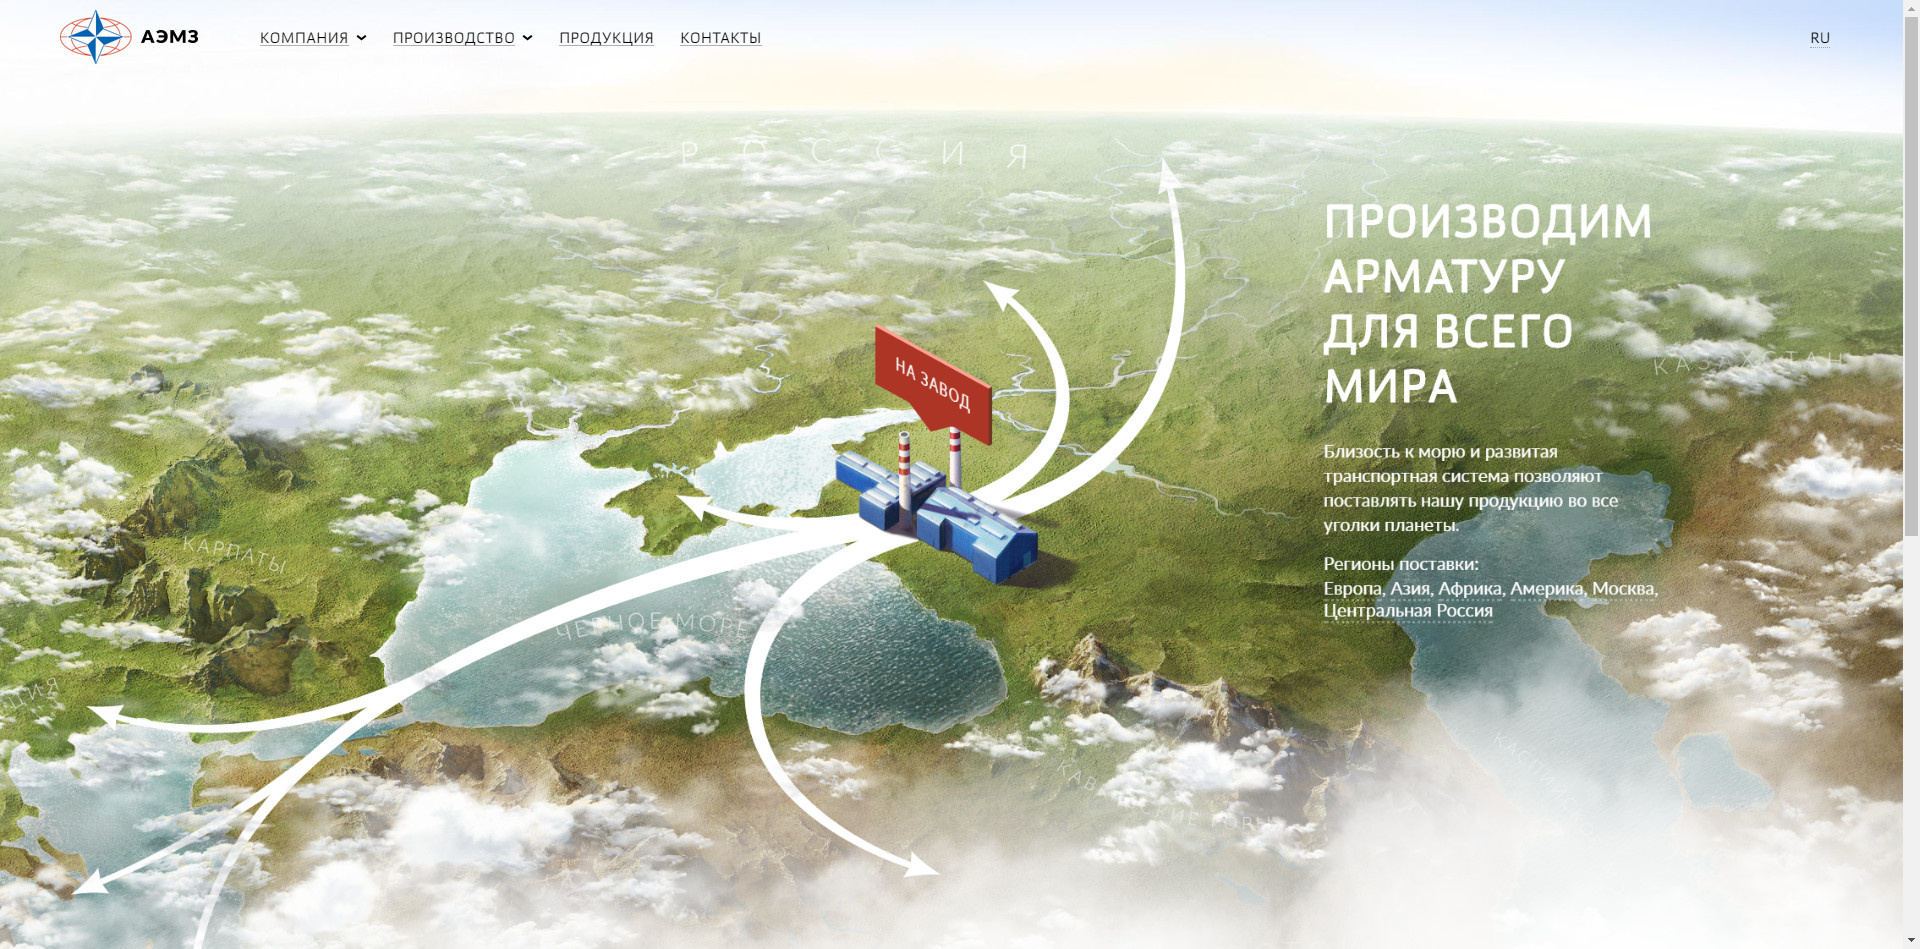
www.abinmetall.ru
Answer the question
In order to leave comments, you need to log in
I looked at the code - there is nothing supernatural. CSS3 animations, SVG arrows, some javascript...
Check it out too =)
Formally, this is not a map at all, but a kind of artistic picture.
The contours of the seas look like in the Mercator projection, and the view of the Earth's surface at the same time is not perpendicular to it, but is directed at an angle. So this particular picture was drawn by hand, at least partially, without using a real model of terrain heights. With the contours of the rivers - the same story. So, most likely, they combined the landscape, which was roughly sketched in a three-dimensional editor, with the contours, which were outlined and slightly edited according to the screenshot from Google Maps.
Can you give me a link to see it? What do you want to describe? picture?
Didn't find what you were looking for?
Ask your questionAsk a Question
731 491 924 answers to any question