Answer the question
In order to leave comments, you need to log in
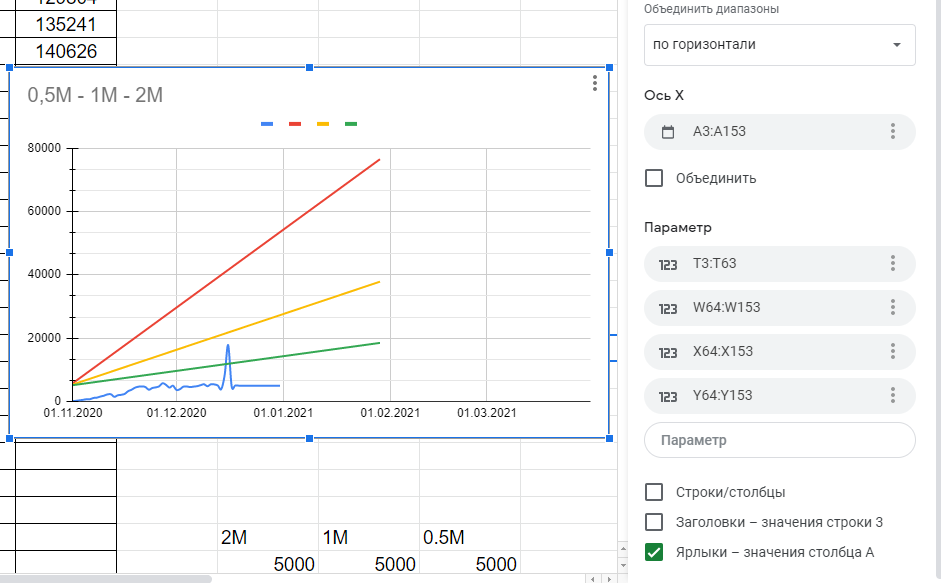
Google Sheets: how to make two charts start on different dates?
There is an x-axis that contains dates. Cells A3:153.
There is a Y-axis along which there are several charts, but it is important that one of them should be tied to dates in cells from A3:A63, and all the other three should start from A63 and go up to A153.

Those. where one graph ends on the x-axis, others begin.
But I can't do it. Is such a sequential placement of graphs possible?
Answer the question
In order to leave comments, you need to log in
So place the data: one graph on one date, and the rest - starting from another. If the line from 0 interferes, make the graphs that should "begin further" have all the first values zero.
Table example
Didn't find what you were looking for?
Ask your questionAsk a Question
731 491 924 answers to any question