Answer the question
In order to leave comments, you need to log in
Could this graph be talking about "normal disk activity"?
The server has a very strange behavior expressed in the fact that the server is trotting, moreover, for several seconds
while
1. this is not a raid
2. not a percentage and not a RAM because they are really busy by 2%
3. not a database because it is not loaded
4. not IO because iotop shows 1-2% I/O load (500-3000Kb each, which is not enough for ssd)
In general, the server is cold, but there is throttling
And yes, this is not a network
The only deviation is Load Avarage 5-7 and it seems not so much but at 2% load there are a lot of servers.
And here is the strangest graph (the disks in the raid are glued and divided into two virtual ones) 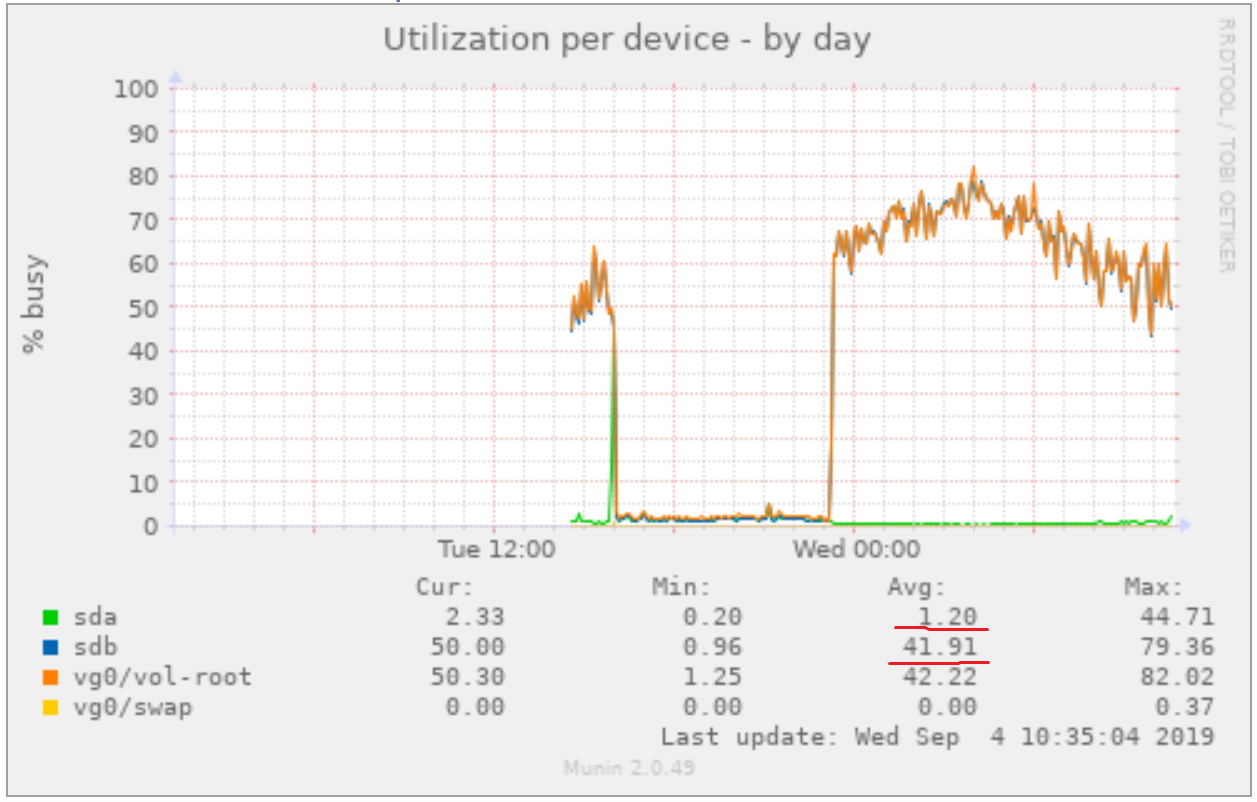
Can one of the disks in the mirror be loaded 40 times more than the second?
At the same time, real IO does not even reach 300 megabytes per second, it rarely rises to 1 megabyte.
12 cores by 4, so it's not a matter of speed
trotting absolutely everything, even ssh!
91.206.15.17/11.gif
Answer the question
In order to leave comments, you need to log in
Check the SMART of the disks, since this schedule of the so-called "utilization" is built, as far as I remember, based on the filling of the read / write queue, if the disk is stupid because it is busy with the relocation of bad blocks, then its queue will be full even with minimal load and therefore the utilization will be displayed high.
Didn't find what you were looking for?
Ask your questionAsk a Question
731 491 924 answers to any question