Answer the question
In order to leave comments, you need to log in
C# WinForms Chart - Quadratic Spline Function?
Hello!
I ask for help - to understand the following question.
There is a quadratic function given as y = 0.5773 * x^2 + 0.6183 * x - 0.0331.
There are X points:
0.057
0.177
0.283
1.087
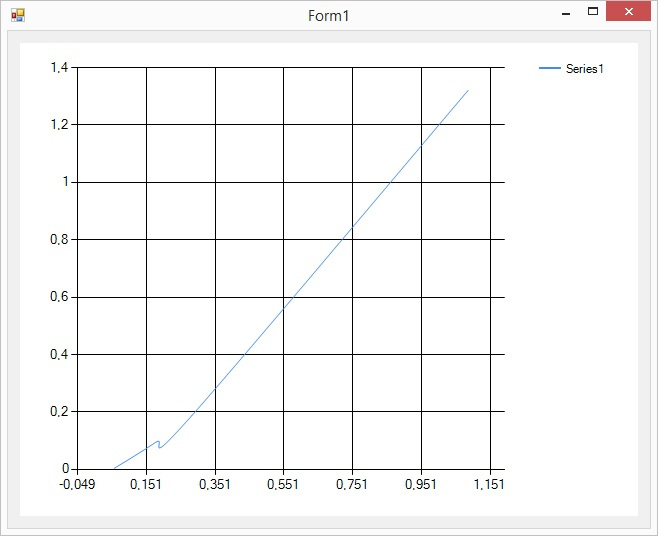
There is a Chart component. ChartType for the chart is set to Spline.
The output is the following picture: 
What kind of extra bend in the graph? How to get rid of it?
Need a smooth square line.
I am also attaching the source code.
public Form1()
        {
            double[] X = new double[4] { 0.057, 0.177, 0.283, 1.087 };
            double[] Y = new double[4];

            for (int i = 0; i < X.Length; i++)
                Y[i] = CalcPolynom(X[i], new double[3] { -0.0331, 0.6183, 0.5773 });


            InitializeComponent();

            Series s = chart1.Series[0];

            for (int i = 0; i < X.Length; i++)
                s.Points.AddXY(X[i], Y[i]);
        }

        double CalcPolynom(double x, double[] coeffs)
        {
            double y = 0;
            double x_interim = 1;

            for (int i = 0; i < coeffs.Length; i++)
            {
                y += x_interim * coeffs[i];
                x_interim *= x;
            }

            return y;
}Answer the question
In order to leave comments, you need to log in
Didn't find what you were looking for?
Ask your questionAsk a Question
731 491 924 answers to any question