Answer the question
In order to leave comments, you need to log in
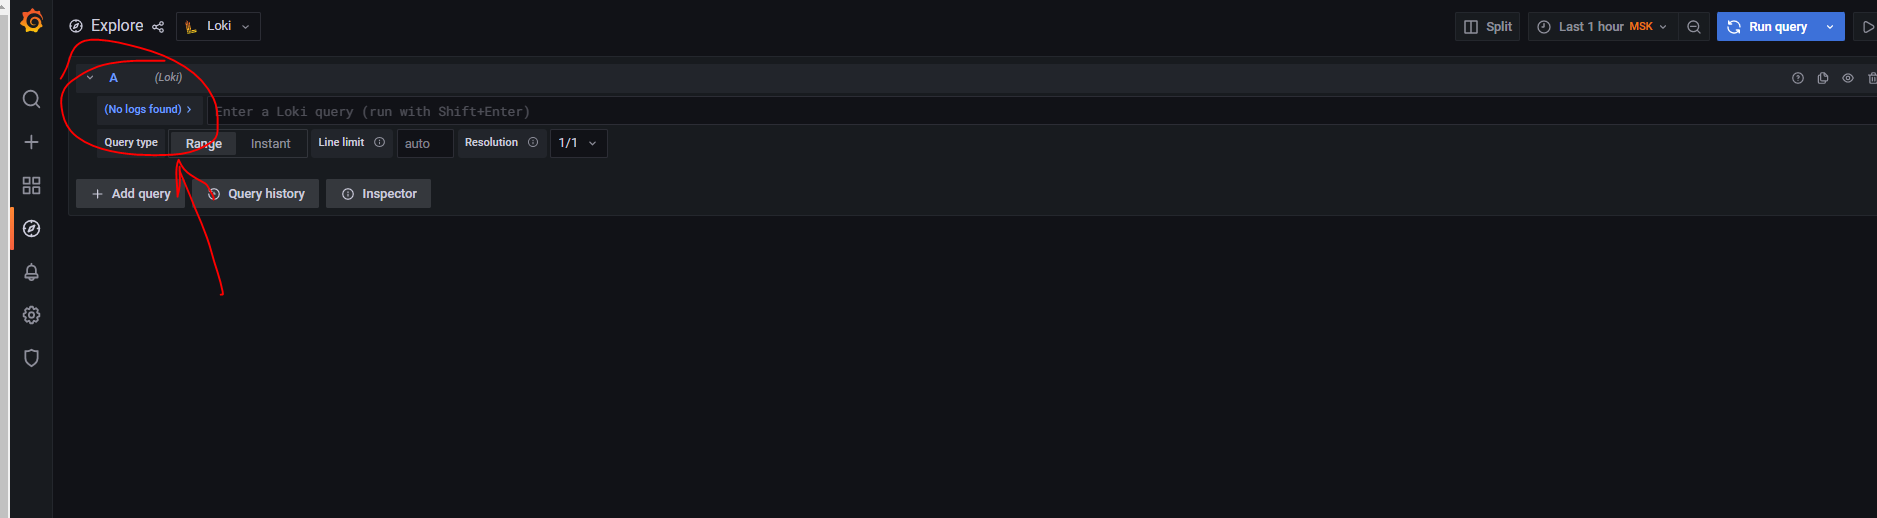
Why is LOKI not working in grafana - zabbix?
Help people!
I ran into such a problem, I connected Loki to Grafana, installed promtail and registered the config . This config
/etc/promtail/promtail.yaml
:
server:
  http_listen_port: 9080
  grpc_listen_port: 0

positions:
  filename: /tmp/positions.yaml

clients:
  - url: http://192.168.*.*:3100/loki/api/v1/push

scrape_configs:
- job_name: system
  static_configs:
  - targets:
      - localhost
    labels:
      job: varlogs
      __path__: /var/log/*log
- job_name: grafanalogs
  static_configs:
  - targets:
      - localhost
    labels:
      job: grafana
      __path__: /var/log/grafana/grafana.log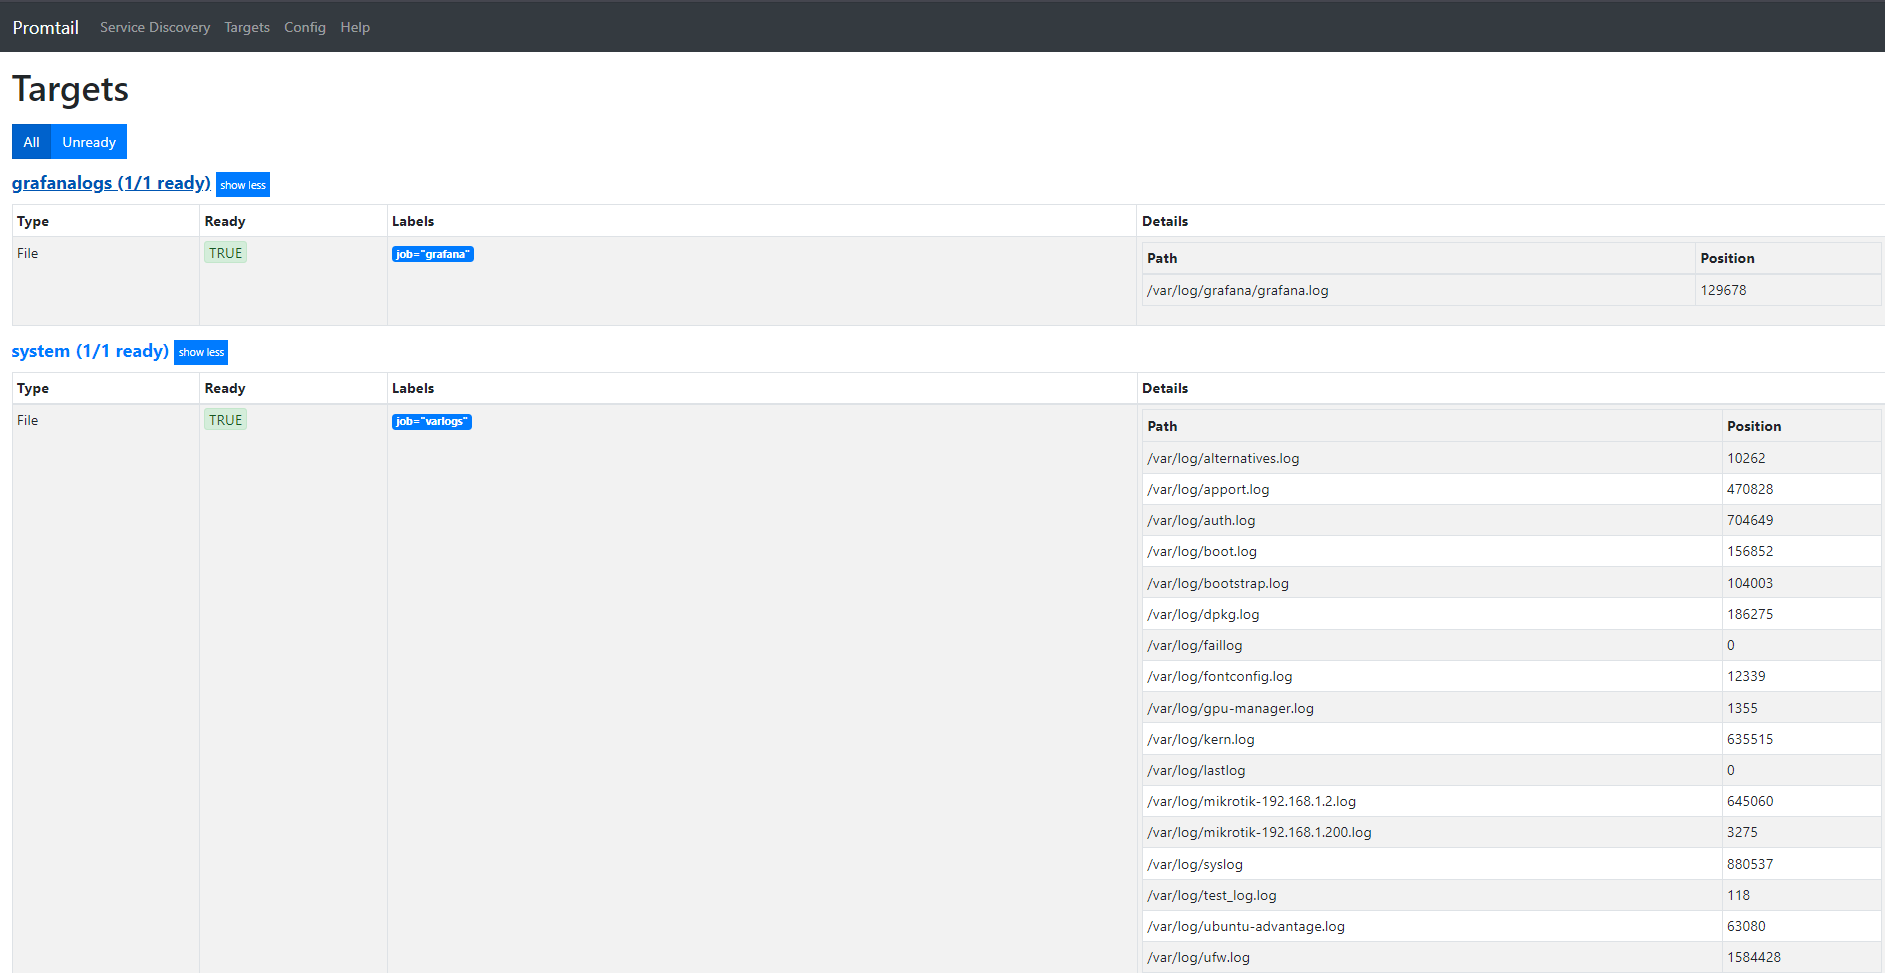
Answer the question
In order to leave comments, you need to log in
* I give the answer myself, maybe it will come in handy for someone!
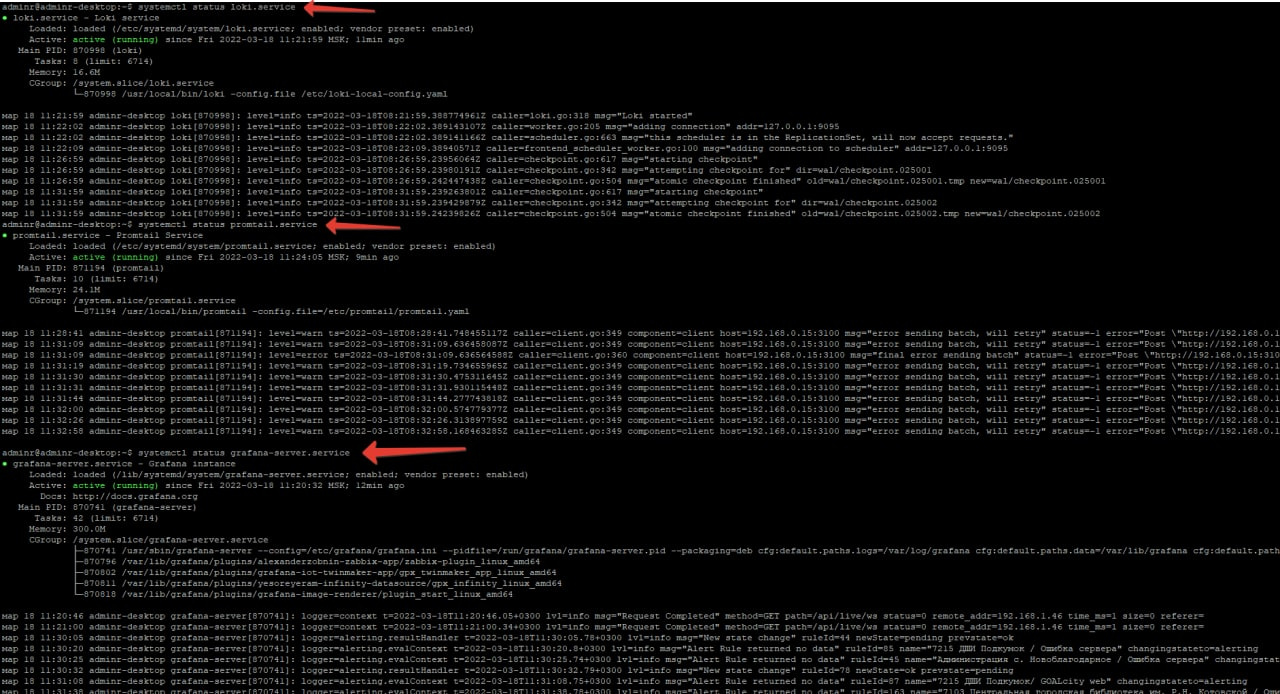
If you have the same, wait, grafana processes for a long time and does not display data immediately! everything is up and running great.
commands like:
systemctl restart promtail.service
or
systemctl restart demon*** do not work immediately !
Didn't find what you were looking for?
Ask your questionAsk a Question
731 491 924 answers to any question