Answer the question
In order to leave comments, you need to log in
Why is Grafana not reading the metric correctly?
Good afternoon, colleagues.
Please advise on this matter. There is a UPS Premium Tower (centiel) 100kW.
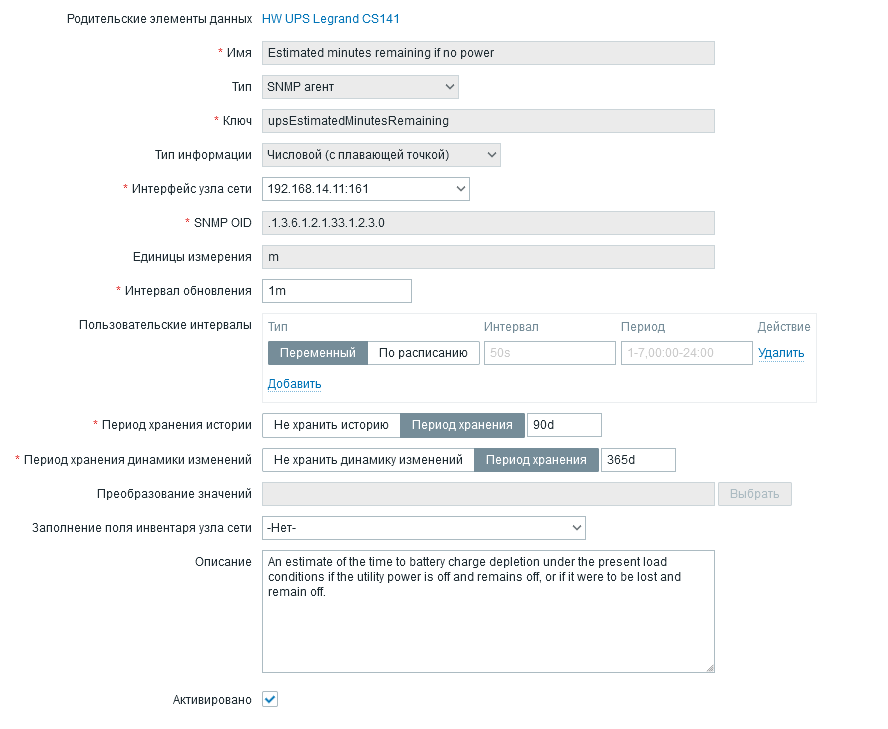
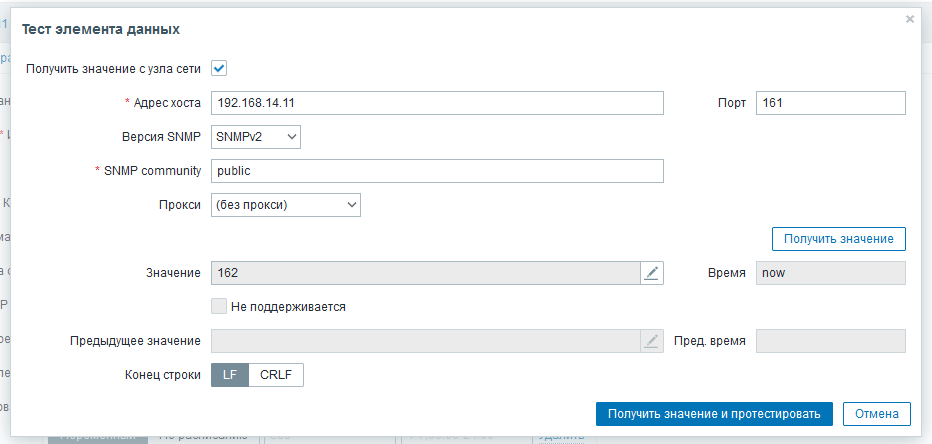
Smnp configured. The metric of UPS operation time without power is removed. Zabbix itself removes the metric correctly, the time is displayed in minutes.


But when the metric gets on the grafana dashboard, the latter converts it to strange values, like 1.8 hours, or 2.7 hours.

I played in different ways, removed units in zabbix, removed them in grafana, tried to do preprocessing in zabbix by adding custom multiplier 0.1 or 0.01. The result is still the same, the metric is not displayed correctly in the grafana. Tell me which way to look?
Answer the question
In order to leave comments, you need to log in
Didn't find what you were looking for?
Ask your questionAsk a Question
731 491 924 answers to any question