Answer the question
In order to leave comments, you need to log in
Why doesn't Zabbix show graphs when monitoring iostat?
I do it according to the manual
https://habrahabr.ru/post/220073/
On the Zabbix server, I checked
zabbix_get -s IP_ADDRESS -k iostat.discovery
in response to JSON with disks. So the script is working.
The LatestData Iostat (13 Items) are gray.
The charts are empty.
Timeout for the agent made 30.
All items show an error
Received value [FATAL: datafile not found] is not suitable for value type [Numeric (float)]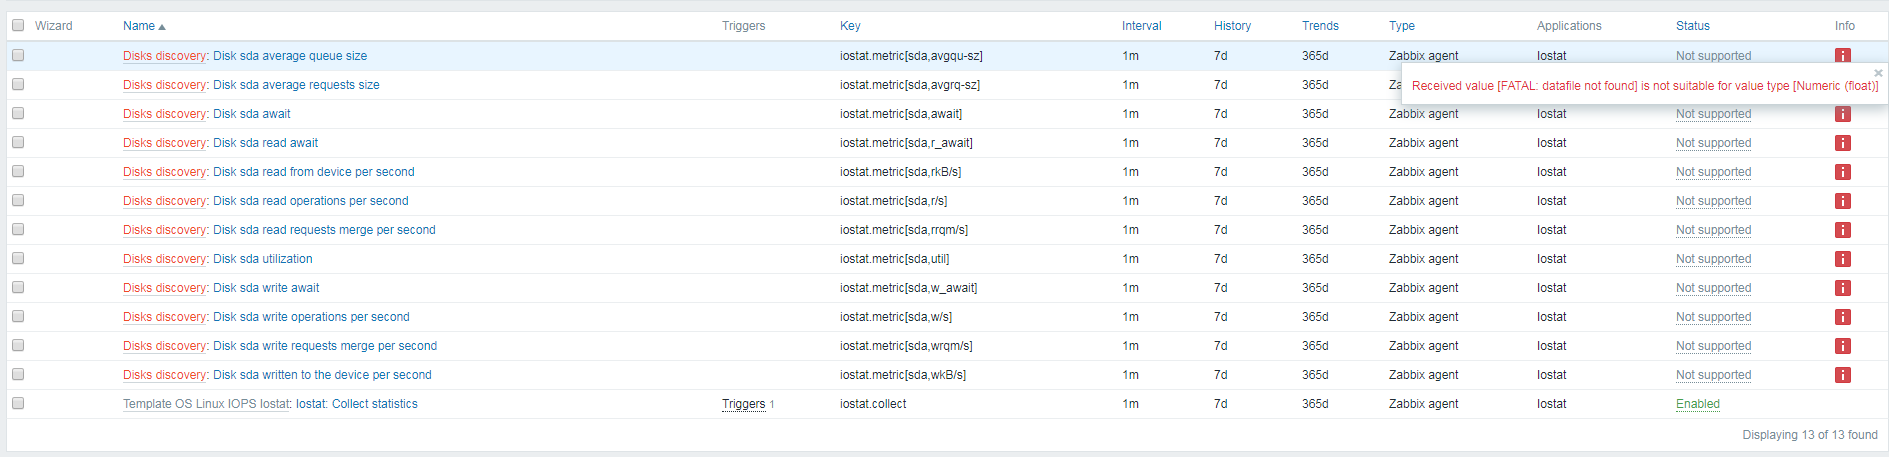
Answer the question
In order to leave comments, you need to log in
1 iostat.discovery does not run any script at all, but simply executes a set of commands specified in iostat.conf.
2 when polling items, /usr/libexec/zabbix-extensions/scripts/iostat-parse.sh is launched - open it and see where the "FATAL: datafile not found" error is generated, then look for what is wrong with you.
Didn't find what you were looking for?
Ask your questionAsk a Question
731 491 924 answers to any question