Answer the question
In order to leave comments, you need to log in
Where are the values for this python table coming from?
Good day, I want to implement the HOG algorithm, but I don’t fully understand the theory.
More or less the theory is shown in the English video:
https://youtu.be/28xk5i1_7Zc
That is, there is nothing complicated here, using numpy and self-written algorithms, I calmly implement everything
But I can’t I can’t understand where these values \u200b\u200bcome from (circled in green in the photo) 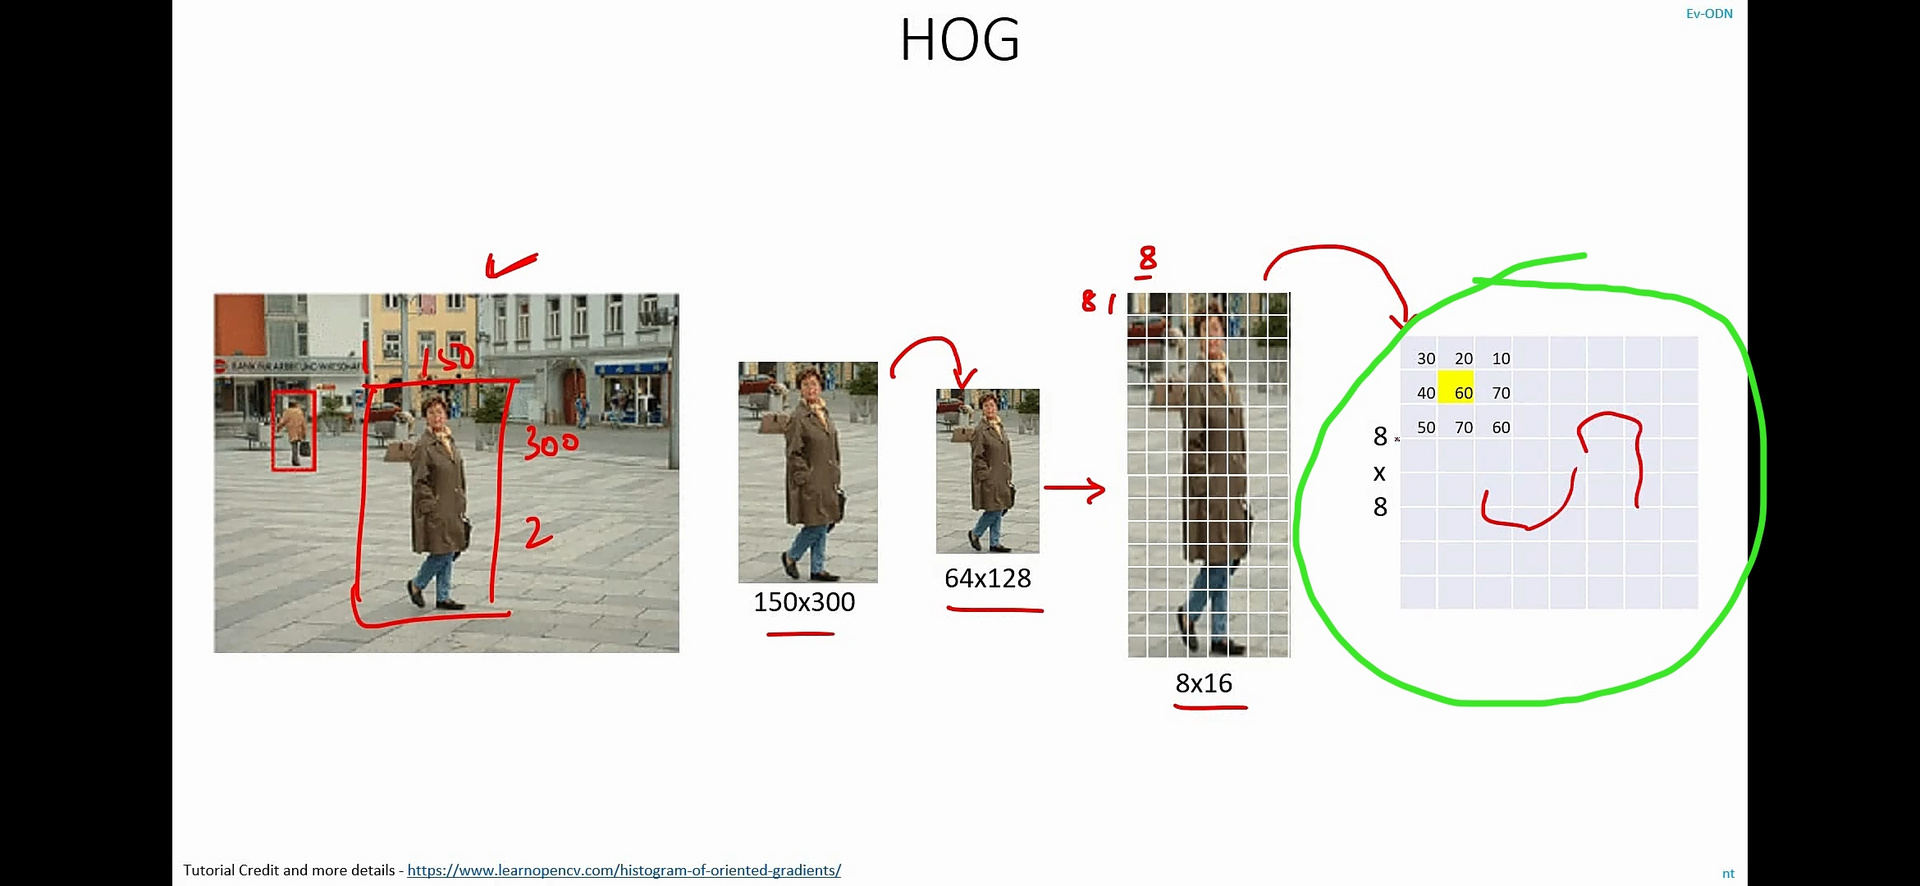
Please help me figure it out
Answer the question
In order to leave comments, you need to log in
A gradient is a transition from dark to light. The whole algorithm is aimed at identifying faces and the angle of rotation of faces in an 8x8 cell. The edge is just well defined with the help of a gradient, where the difference in brightness between adjacent cells is greater, there will be a edge, I hope I didn’t stupidly explain.
What is highlighted in green:
1. For each point in the image, the algorithm calculates the direction of the gradient (the angle of the vector relative to the x-axis) and the amount of change in the gradient (smooth transition or sharp transition).
This is shown in the video on the next slide. The calculation is carried out using neighboring points, and as I understand it, not all points are needed in the calculation, the corner ones are discarded. In other words, this is a kind of filter overlay on the picture
PS
2. We determined for each point the magnitude of the gradient change and its angle, now we need to generalize, which will have a beneficial effect on the quality and speed of classification, based on the experience of the authors.
To do this, we build a histogram of gradients for an 8x8 cell. (see further in the video) This histogram can also be represented as a 9-dimensional vector. Roughly speaking, from the histogram, you can understand which direction of the gradient is stronger and which is weaker in a given cell.
3. Then the vector is usually normalized, that is, all its values are reduced to values from 0 to 1.
But the authors went further, they took more information from neighboring cells for each 8 by 8 cell, added it in a certain way, normalized it and got a 9x4 vector.
This HOG descriptor can be visualized (see video) - on a black background in each 8x8 cell, we see the direction of the gradient in the form of short stripes.
As a result, 4 histograms are formed for each cell, 7 such vectors will fit into the sliding window horizontally, 15 vectors vertically, and the total dimension of the feature vector for the sliding window is: 15*7*9*4 = 3780
cm more details gs-studio .com/news-about-it/31930-object-detection...
Didn't find what you were looking for?
Ask your questionAsk a Question
731 491 924 answers to any question