Answer the question
In order to leave comments, you need to log in
How to find repetitions in a sequence?
There is data from the sensors, for example: 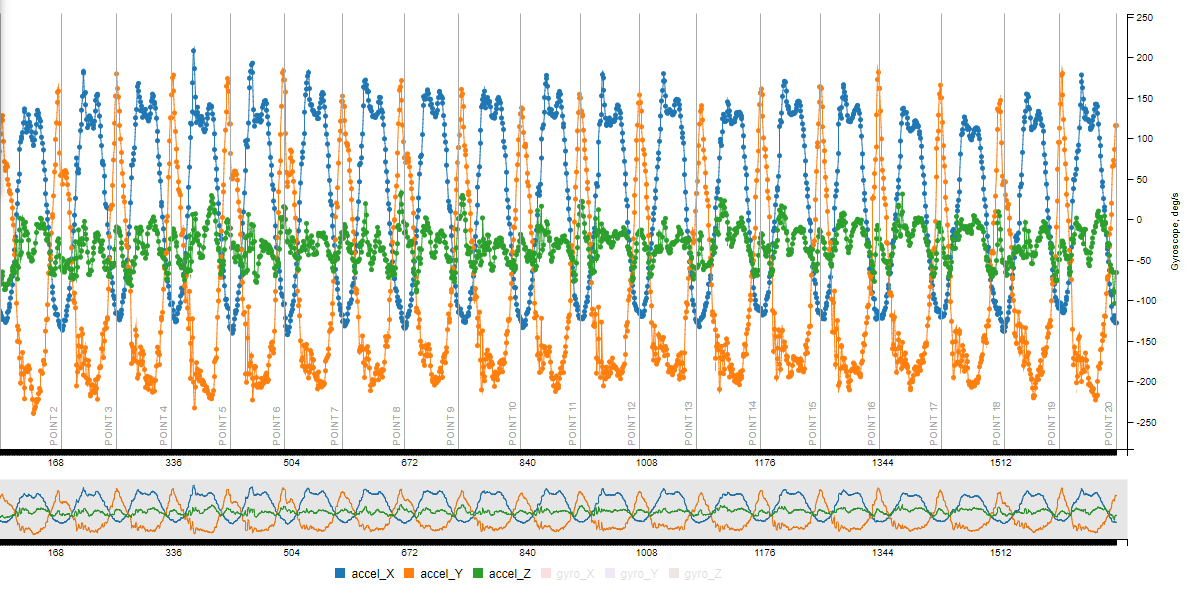
in it, each repetition is manually marked with a gray line. But there is a lot of data to mark them manually. Also, the oscillations have a very different shape (but the repetitions are very similar to each other).
How can you programmatically determine the boundaries of each repetition?
Any advice, any algorithms will help. And if there are ready-made libraries, then this is great!
Answer the question
In order to leave comments, you need to log in
1. We take the time range we need.
2. On it we find the extreme values max and min for the peak values of the indicators (along the vertical axis).
3. Divide in half ((max-min) / 2) and get the horizontal axial value specifically for this indicator / graph.
4. Then we take the segment of the intersection of this axis: from the positive zone to the negative one (and vice versa) and inside this zone we look for max and min values along the vertical axis, depending on the direction of intersection.
5. The found values will indicate the separation through a time indicator.
Every 2nd - and will be the desired gray line.
Build a fast Fourier transform and look for the maximum in it. This will be the repetition frequency f. Next, look for a point that you like (extremum, for example) and separate the data with a period of 1/f. You can also use autocorrelation, but in fact, in a quick execution, it will come down to the same thing.
Do not complicate the task unnecessarily. Where X passes through 50 down - there is a border. If you really need to match exactly with the gray lines - shift by a constant.
Didn't find what you were looking for?
Ask your questionAsk a Question
731 491 924 answers to any question