Answer the question
In order to leave comments, you need to log in
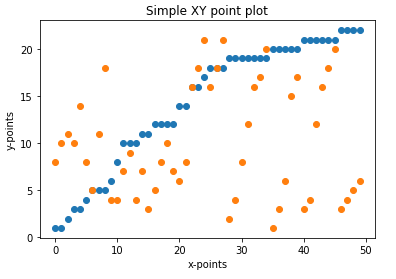
Where are the extra points on the graph?
I'm trying to display the points on the chart, but for some reason extra blue points are drawn, and the points from the array are shifted along X. What is the error?
import numpy as np
import matplotlib.pyplot as plt
dots = np.array()
fig = plt.figure()
ax = fig.add_subplot(111)
ax.plot(dots, 'o')
ax.set_xlabel('x- points')
ax.set_ylabel('y-points')
ax.set_title('Simple XY point plot')
fig.show()
Answer the question
In order to leave comments, you need to log in
It is very difficult to understand what you are actually trying to do. But I suspect it is:
import numpy as np
import matplotlib.pyplot as plt
dots = np.array()
x=[i[0] for i in dots]
y=[i[1] for i in dots]
fig = plt.figure()
ax = fig.add_subplot(111)
ax.plot(x,y, 'o')
ax.set_xlabel('x-points')
ax.set_ylabel('y-points')
ax.set_title('Simple XY point plot')
fig.show()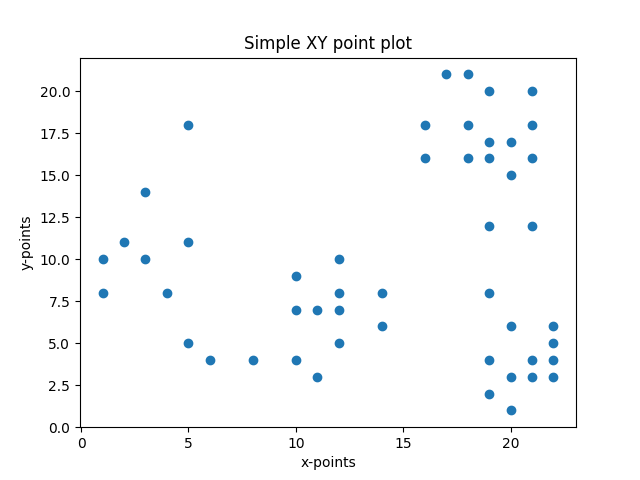
Didn't find what you were looking for?
Ask your questionAsk a Question
731 491 924 answers to any question