Answer the question
In order to leave comments, you need to log in
When changing PHP versions, the disk load increases, what should I do?
There is a server - a dedicated server, 2 processors with 6 cores for hypertrading ,
48gb ram, for a database an SSD hard disk,
for
a HDD program code
OS - Ubuntu server 16.04 .
This application keeps the load (for monitoring) ~300 rps to the backend, the
load on the database is ~400prs select, ~270rps insert, ~160rps update, ~1 delete, a lot of statistics are
written and it is not written in the most optimal way - insert .. on duplicate key update ...
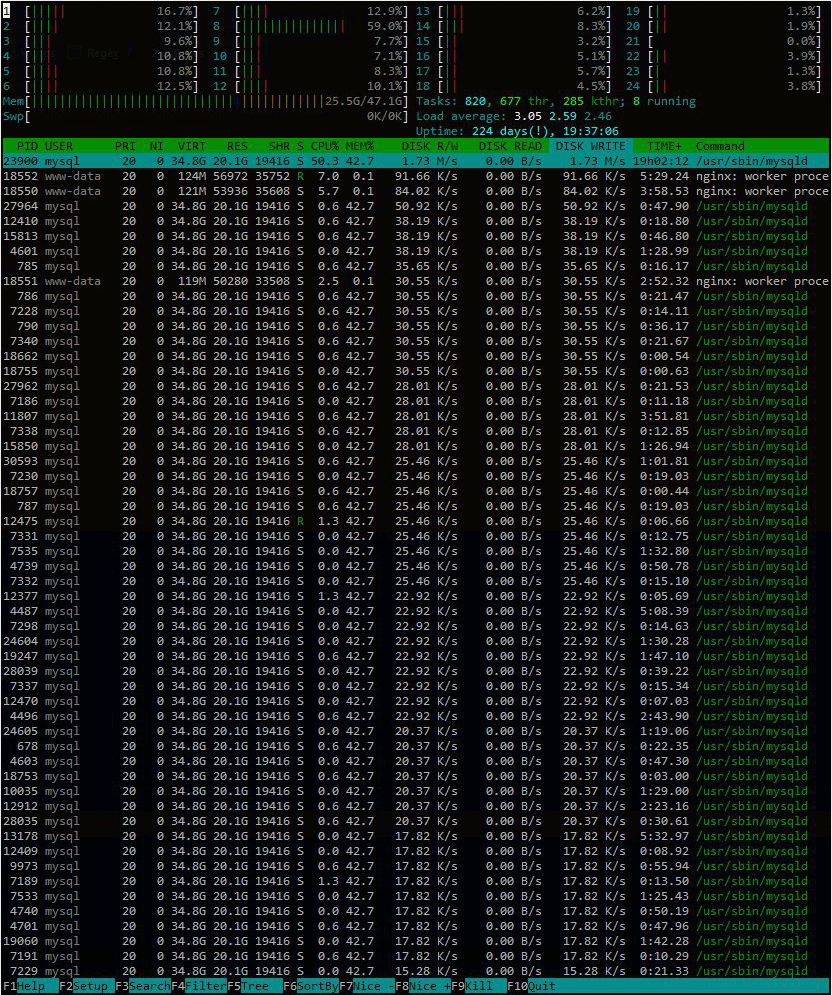
But the server lives, load average ~3 and everything works
There is a 2nd version of this application on php7.2, written on yii 2. Production mode is on. It contains statistics
moved to queues that run on rabbitmq, workers are also made on yii 2, statistics data is
aggregated in redis and uploaded to MariaDB every 20 minutes. On the
database, the load is less than ~300prs select, ~130rps insert, ~80rps update, ~1 delete.
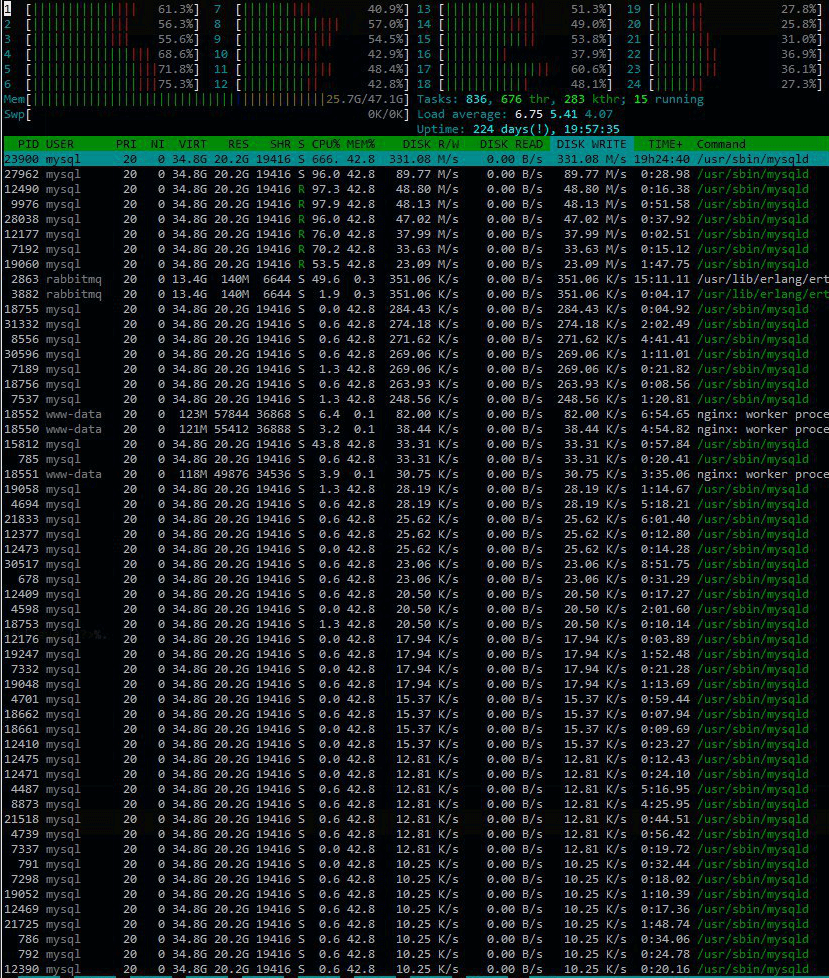
But despite the lower load, MariaDB starts to use the disk very actively.
Not only at the moments when data is transferred from Redis to MariaDB, but constantly. It writes so strongly
that latency grows and everything hangs and the server does not have time to give answers. 
What was changed in the config:
[mysqld]
skip-name-resolve
max_connections = 1000
connect_timeout = 5
wait_timeout = 600
max_allowed_packet = 32M
= 128M
sort_buffer_size bulk_insert_buffer_size = 1G
tmp_table_size = 2G
max_heap_table_size = 2G
key_buffer_size = 256M
query_cache_limit = 1M
query_cache_size = 128M
innodb_log_buffer_size = 128M
innodb_log_file_size = 1G
innodb_buffer_pool_size = 20G
innodb_buffer_pool_instances = 10
innodb_io_capacity = 800
innodb_write_io_threads = 16
innodb_read_io_threads = 16
Help! Where to dig? What to watch? What options to reduce the load on the disk are there?
Maybe something is wrong with the framework?
Answer the question
In order to leave comments, you need to log in
Analyze what exactly mysql is doing at this time, at least by running mytop and looking at the explain of frequent and long queries.
You may simply lack some necessary index in the table, or some query was unsuccessfully compiled, and full scan or file sort is actively used.
enable schema caching in Yii2, otherwise Yii2 does a lot of extras. requests
'db' => [
.....
    'enableSchemaCache' => true,
    'schemaCacheDuration' => 3600,
    'schemaCache' => 'cache',
]innodb_flush_method = O_DSYNC
innodb_flush_log_at_trx_commit = 0MrKMV34
~300 rps consumes a lot of resources.
Try putting Blackfire.io or XHProf on the server.
I think you will learn a lot of interesting things about the reason for the high load.
"DB load ~400prs select" is nothing at all, unless, of course, these are super heavy queries with INNER JOIN for 10 tables.
After that, it makes sense to run https://github.com/major/MySQLTuner-perl and see the recommendations.
Didn't find what you were looking for?
Ask your questionAsk a Question
731 491 924 answers to any question