Answer the question
In order to leave comments, you need to log in
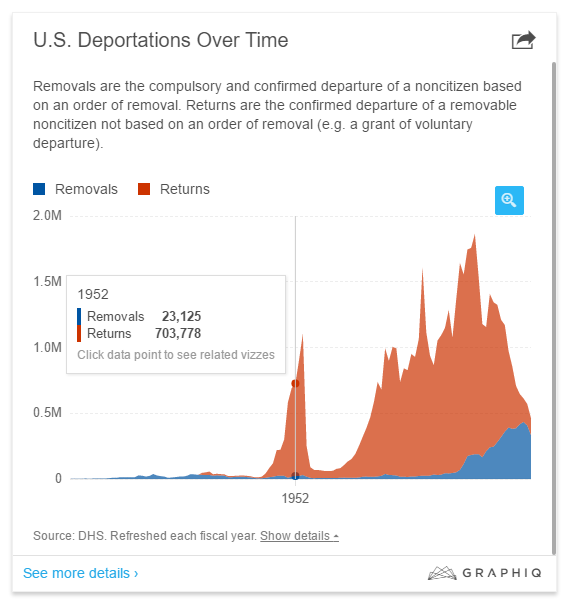
What technology (product) is used for this graph?
Hello!
Need help finding a solution to create such a graph (an example source is here , and a screenshot is at the end of the question). For my purposes, this is the most suitable shell and functionality, so I would like to ask an expert:

Answer the question
In order to leave comments, you need to log in
D3js
(taken out in response from the comments) It is this graph that is built on D3 - see the source code of the widget frame of this graph.
D3 is a library, starting from the 4th version - a set of separate modules. There are no “ready-made” charts in D3 itself, but there is everything for building any chart: beautiful, with interactive and animations, loading data from external sources, etc. You can, of course, take someone's examples of graphs on D3 and modify them to fit your needs.
The cost of developing a custom chart, as in the example, I would very roughly estimate in the range from $100 to $1000.
Didn't find what you were looking for?
Ask your questionAsk a Question
731 491 924 answers to any question