Answer the question
In order to leave comments, you need to log in
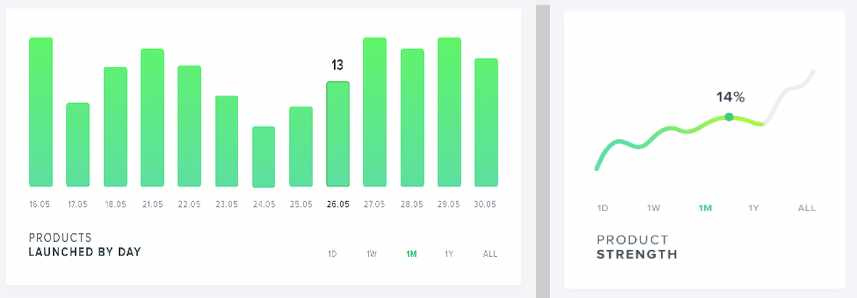
What library to use for plotting/charts data?
Hello!
I need to integrate graphics into the page, exactly according to the design.

Tell me, maybe someone came across, which library is better to use for this task? If I understand correctly, the buttons for changing the timeline (1D 1M 1Y ALL) should be part of the library
Answer the question
In order to leave comments, you need to log in
Google charts https://developers.google.com/chart/
ChartJS www.chartjs.org
You take the designer by the scruff of the neck and shake him, shaking out the information on the basis of which charts he made the design. If nothing intelligible can not answer, then do something similar on any library. If something similar does not suit you, ask for money for the development of charts for this particular project. And generate them on canvas, or on svg.
Didn't find what you were looking for?
Ask your questionAsk a Question
731 491 924 answers to any question