Answer the question
In order to leave comments, you need to log in
What Js-library for drawing graphs would you recommend for this task?
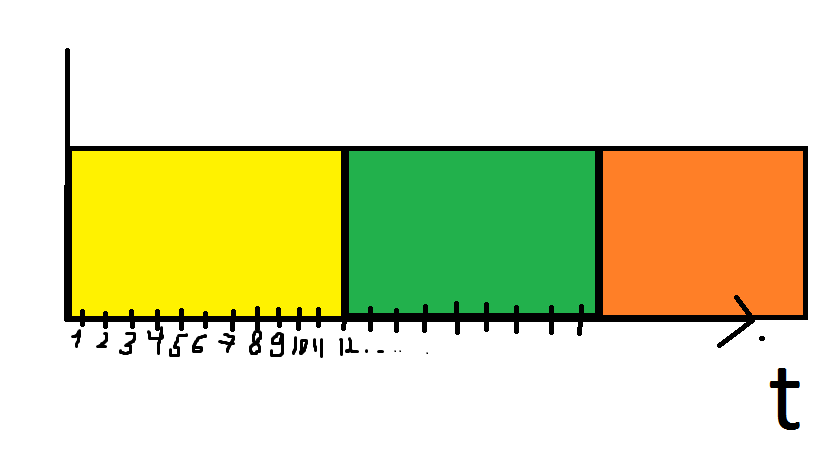
I need a js library that would help me draw a graph.
I have data - the start and end times of the process, these processes go in turn, sometimes there are
no new processes between them for some time
. well, or at least the boundary between them should be clearly visible, plus information about this process should be written when hovering. 
Answer the question
In order to leave comments, you need to log in
Didn't find what you were looking for?
Ask your questionAsk a Question
731 491 924 answers to any question