Answer the question
In order to leave comments, you need to log in
What is better to use for charting?
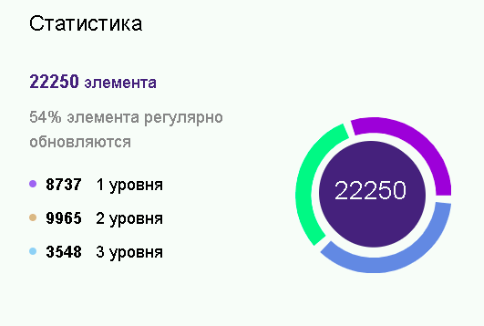
What library would be the easiest way to implement such a chart? Maybe there are some examples?
The fact is that by default the diagram shows the total value of the elements, but when you click on the levels, the values should change and the necessary blocks should be highlighted in it.

Answer the question
In order to leave comments, you need to log in
An excellent library for graphs, especially interactive ones - d3js
There is no ready-
made solution there, but there is everything you need to build one. Check out the gallery of examples .
And in particular donut chart and Pie chart update .
Didn't find what you were looking for?
Ask your questionAsk a Question
731 491 924 answers to any question