Answer the question
In order to leave comments, you need to log in
What charts and types of visualization do you know?
Here's what I found:
- ER diagrams
- UML diagrams
- Mindmap
- Flowchart / flowchart
- Treemap diagrams
- Sunburst diagrams
- Histogram
What else can you add to this list?
What tools are used to visualize systems, algorithms, processes?
What is the name of this visualization? 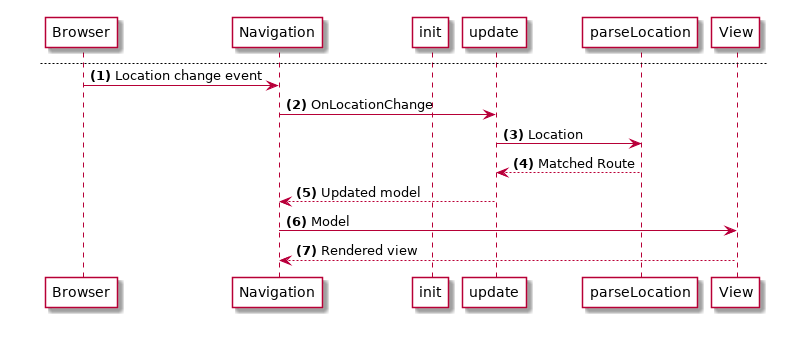
What software is used here?
Answer the question
In order to leave comments, you need to log in
"Horses mixed up in a bunch, people ...." In one list ER diagrams (conceptual description of data), Histograms (from the field of statistics and data analysis), Sunburst diagrams (data analysis), Mindmap (structuring concepts and knowledge) UML diagrams ( a graphical description language for object modeling)..... By the way, is it okay that at the moment there are 12 types of diagrams that are combined under the "roof" of UML? And the "visualization" in the diagram given in the question is a UML sequence diagram.
Your question is like "There are languages Russian, English, C++, Javascript, FORTRAN, Aesopian, body language, veal, bell language. What else can you add to this list."
If you want to get an answer exactly on the topic that interests you, then specify in which area of knowledge or science you are interested in "diagrams and visualization".
Didn't find what you were looking for?
Ask your questionAsk a Question
731 491 924 answers to any question