Answer the question
In order to leave comments, you need to log in
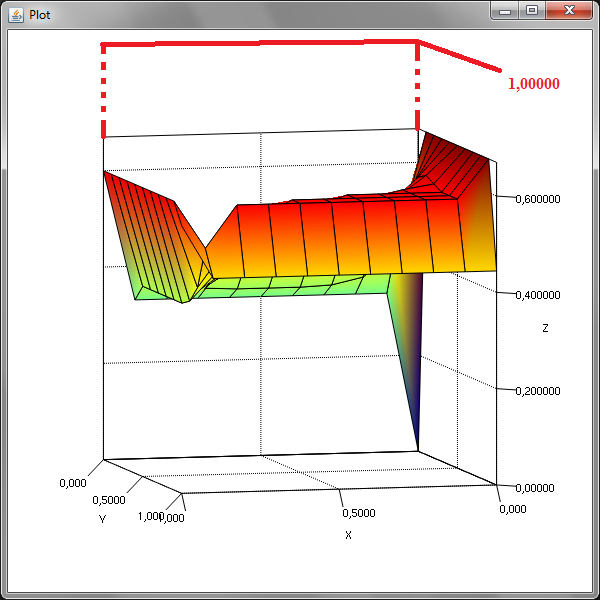
[upd] How to set the range of the axes of the graph of a surface built from polygons when using the Jzy3d library?
Old problem solved:
Can you please tell me how to build a 3D surface in Java from a set of coordinates [X,Y,Z] (preferably with examples)?
I tried using the Jzy3D library , but the lack of documentation, working examples and knowledge put an end to these attempts.
UPD: New problem:
How to make the scale of the graph axes from 0.0 to 1.0 on the Z axis (see image)
public class 3dSurface {

    public static void main(String[] args) {
        double[] xzCoord = {0.0, 0.1, 0.2, 0.3, 0.4, 0.5, 0.6, 0.7, 0.8, 0.9, 1.0};
        double[] yzCoord = {0.0, 0.1, 0.2, 0.3, 0.4, 0.5, 0.6, 0.7, 0.8, 0.9, 1.0};

        double[][] xyCoord = {
                {0, 0.669999, 0.669999, 0.67, 0.669999, 0.669999, 0.669999, 0.67, 0.669999, 0.67, 0.444456},
                {0.33, 0.423135, 0.514753, 0.567927, 0.598819, 0.609384, 0.598819, 0.588316, 0.588316, 0.588316, 0.444456 },
                {0.33, 0.372351, 0.436996, 0.490949, 0.539678, 0.563004, 0.588315, 0.588316, 0.588316, 0.588316, 0.444456},
                {0.330001, 0.357742, 0.411684, 0.478472, 0.521527, 0.546111, 0.573646, 0.588316, 0.588316, 0.588316, 0.444456},
                {0.33, 0.35482, 0.411684, 0.478472, 0.5, 0.525409, 0.554987, 0.588316, 0.588316, 0.588316, 0.444456},
                {0.33, 0.35482, 0.411684, 0.453888, 0.47459, 0.5, 0.53099, 0.567926, 0.588316, 0.588316, 0.444456},
                {0.33, 0.35482, 0.411684, 0.426353, 0.445013, 0.46901, 0.5, 0.539678, 0.588316, 0.588316, 0.444456 },
                {0.330001, 0.357742, 0.385339, 0.39665, 0.411684, 0.432073, 0.460321, 0.5, 0.554987, 0.588316, 0.444456},
                {0.33, 0.372351, 0.372351, 0.372351, 0.376626, 0.390615, 0.411684, 0.445013, 0.5, 0.588316, 0.444456},
                {0.33, 0.365375, 0.365375, 0.365375, 0.365375, 0.365375, 0.365375, 0.376626, 0.411684, 0.5, 0.444456},
                {0.6, 0.6, 0.6, 0.6, 0.6, 0.6, 0.6, 0.6, 0.6, 0.6, 0.555545}
        };

        List<Polygon> polygons = new ArrayList<Polygon>();
        for(int i = 0; i < xyCoord.length -1; i++){
            for(int j = 0; j < xyCoord[i].length -1; j++){
                Polygon polygon = new Polygon();
                polygon.add(new Point(new Coord3d(xzCoord[i], yzCoord[j], xyCoord[i][j]) ));
                polygon.add(new Point( new Coord3d(xzCoord[i], yzCoord[j]+0.1, xyCoord[i][j+1]) ));
                polygon.add(new Point( new Coord3d(xzCoord[i]+0.1, yzCoord[j]+0.1, xyCoord[i+1][j+1]) ));
                polygon.add(new Point( new Coord3d(xzCoord[i]+0.1, yzCoord[j], xyCoord[i+1][j]) ));
                polygons.add(polygon);
                System.out.println("Still Running");
            }
        }

        Shape surface = new Shape(polygons);
        surface.setColorMapper(new ColorMapper(new ColorMapRainbow(),
                surface.getBounds().getZmin(),
                surface.getBounds().getZmax(),
                new Color(1,1,1,1f)));
        surface.setWireframeDisplayed(true);
        surface.setWireframeColor(Color.BLACK);
        surface.setFaceDisplayed(true);
        System.out.println("A few moments...");

        Chart chart = new AWTChart(Quality.Nicest);
        chart.setViewMode(ViewPositionMode.FREE);
        chart.addMouseController();
        System.out.println("Finishing up...");
        chart.getScene().getGraph().add(surface);
        System.out.println("Done...");
        chart.open("Plot", new Rectangle(200,200,600,600));
    }
}
Answer the question
In order to leave comments, you need to log in
The solution turned out to be simple - the chart can be moved along the Z axis with the Right Mouse Button held down.
Another library will not solve the lack of knowledge problem. And there is a whole brochure on Jzy3D.
Didn't find what you were looking for?
Ask your questionAsk a Question
731 491 924 answers to any question