Answer the question
In order to leave comments, you need to log in
Tools for charts/graphs?
It is necessary to process the sets of log files, pulling out the numbers from there. This, for example, will be done by grep, it will even be possible to drive it into the CSV format, but then (there is a lot of data) you need to build charts and graphs on them.
Recommend a handy tool for beautiful charts and graphs.
OpenOffice does not have sufficient flexibility, and in various web services that help build beautiful graphics, the lack of automation upsets - there is no CSV import, and manually driving such volumes is a very dull job.
We need support for two types:
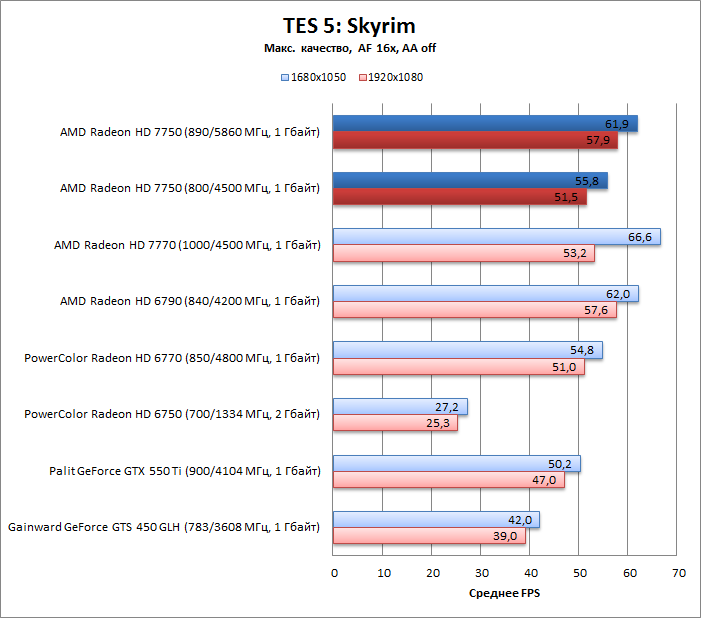
1. charts like those that are usually on ixbt in various tests: 

2. graphs with visual legends and the possibility of a numerical signature for each point (desirable):
Answer the question
In order to leave comments, you need to log in
Try gnuplot. The beauty of the final graphs in it is not difficult to achieve.
Try pChart .
Another very flexible JpGraph
thing,
well, there is also the Google Chart API
gnuplot as already said. Histograms builds perfectly
. You
can also look at UDAV , similar to a gnuplot.
Didn't find what you were looking for?
Ask your questionAsk a Question
731 491 924 answers to any question