Answer the question
In order to leave comments, you need to log in
How to make a cool graph in JS?
Hi all!
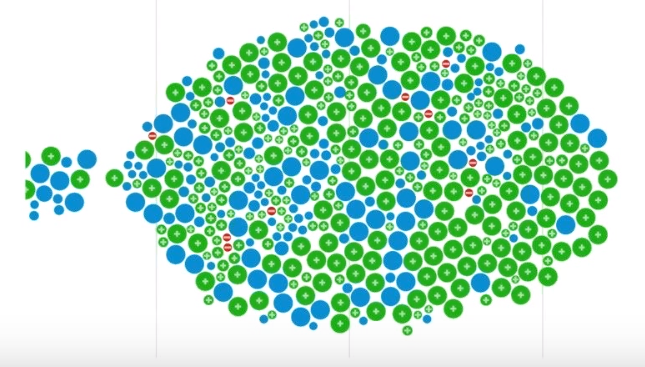
You need to make a graph like in the image. 
Each circle: x, r, color (y - calculated).
JavaScript
Have you ever met that allow you to build this?
If you build at the canvas level, what would you advise?
Thank you!
Answer the question
In order to leave comments, you need to log in
Didn't find what you were looking for?
Ask your questionAsk a Question
731 491 924 answers to any question