Answer the question
In order to leave comments, you need to log in
Optimizing mysql 8.0.15 only innodb for 400 million requests per day?
The transition was from mysql 5.7.18 (90% myisam) to mysql 8.0.15 innodb (100%).
Having smoked the off-mana muscle of the 8th (there are no worthwhile articles even over the hill about him) and after a little driving inno and a new muscle on LAN, I decided to make a transition on an online project. The increase in speed is noticed even by eye!
But I'm experiencing problems (because my knowledge of innodb is not enough due to the fact that for the first time I use only innodb on a loaded database)
1*). mysql 8.0.15 somehow behaves strangely in terms of load distribution across all cores / threads out of 16 threads, at first 3-4 were loaded by 80-90% at 6000 online and
ø per minute: 243.575
ø per second: 4.059
after tweaking my.cnf a little and setting irqbalance mysql began to use exactly half of 8 threads out of 16, the remaining 8 are always at 0%.
After thinking a little, I realized that I have innodb_thread_concurrency = 18, re-setting to 34-36 did not give results, but when set to 0 (default), mysql even started to go beyond 8 threads,
but judging by htop it works somehow strange: sometimes 1-2 threads are loaded by 70-90% and the rest 0%-1% (Yes, yes, I understand that a heavy request that cannot multithread cron job, etc., etc. but slow log 2sec is empty and cron cut down to check) ??
In general, I see something like this in htop (this is 200k - + requests per minute)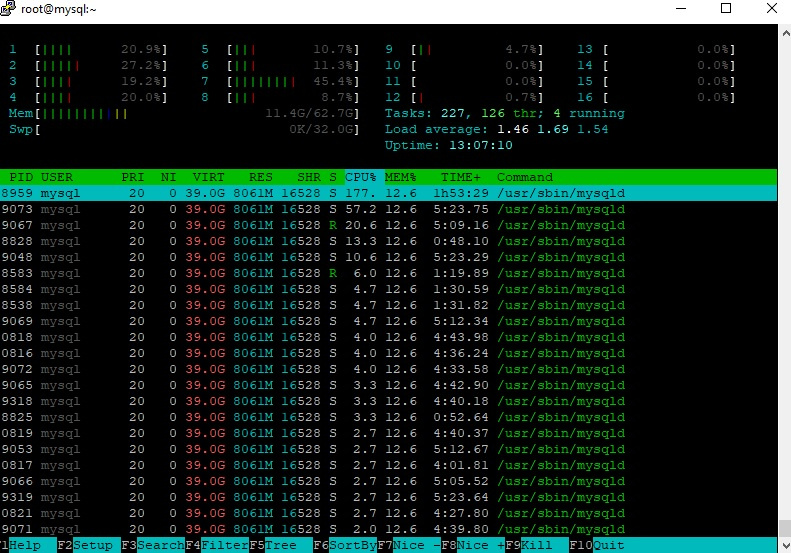
With myisam mysql 5.7, this was not the case mysql almost always hawala almost all threads under such a load, and 1-2-3 threads were loaded at 90% current when a query from cron worked for a long time.
I played with their newest latest implemented features:
innodb_log_spin_cpu_abs_lwm
innodb_log_spin_cpu_pct_hwm
innodb_log_wait_for_flush_spin_hwm
innodb_parallel_read_threads
difference + - I didn't notice the difference by eye (I didn't find any information about them on working projects). Perhaps I did not use them correctly. ended up leaving the default. On these baubles it is interesting to hear a comment from someone who used it in real life.
2*).Why does not the pool eat up the entire allocated buffer, which I gave out to it in 32 gigabytes, but toko 11 gigabytes + - When on mysql 5.7 myisam, a minute after starting the database, it already ate 22+ gigabytes of RAM. ?
mysqltuner I will be able to use Toko tomorrow as the base does not plow at all in time.
Hardware:
i9-9900K, 64gb 2400mhz, 2 ssd over terabyte RAID 1 ( [[email protected] ~]# hdparm -tT /dev/md2
/dev/md2:
Timing cached reads: 33580 MB in 1.99 seconds = 16873.98 MB/sec
Timing buffered disk reads: 7880 MB in 3.00 seconds = 2626.15 MB/sec )
-----------------------
Additions taken at 10k online:
Average reads per cpu peak within 15 min:
%Cpu(s): 9.7 us, 0.6 sy, 0.0 ni, 89.5 id, 0.0 wa, 0.0 hi, 0.2 si, 0.0 st
%Cpu(s): 11.1 us, 0.7 sy, 0.0 ni, 87.9 id, 0.1 wa, 0.0 hi, 0.2 si, 0.0
st
0.0 hi, 0.2 si, 0.0
st
ni, 88.8 id, 0.0 wa, 0.0 hi, 0.2 si, 0.0 st
iotop average:
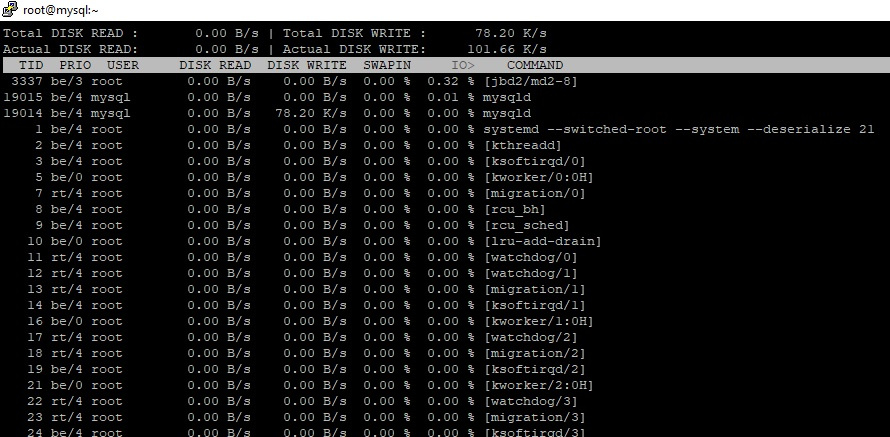
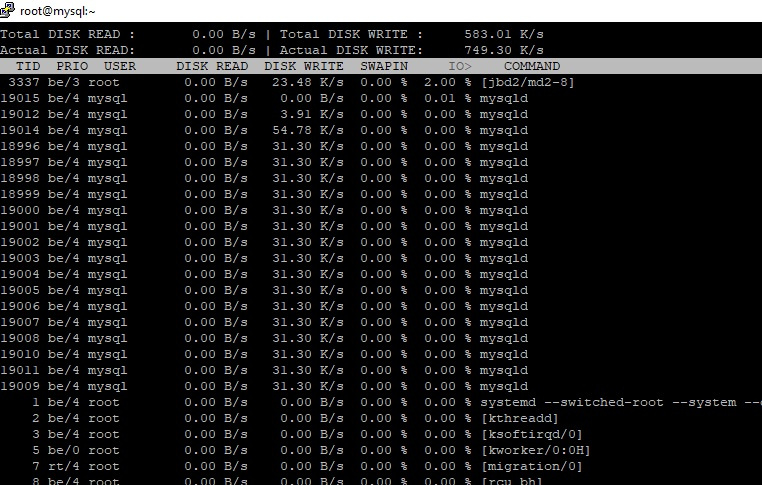
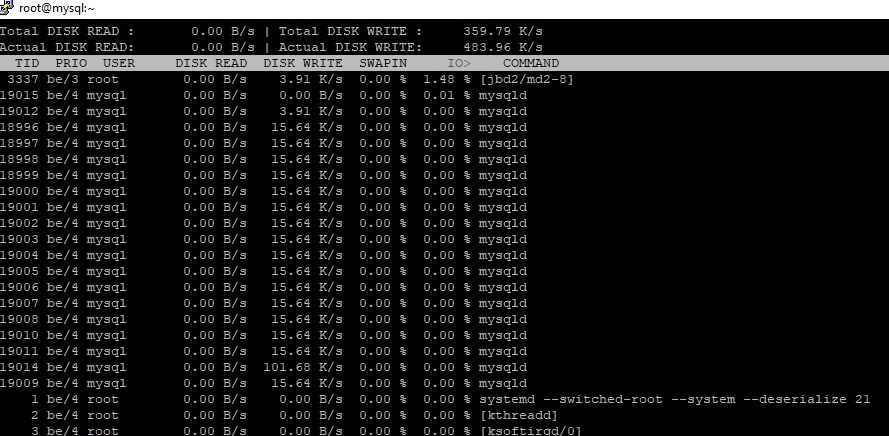
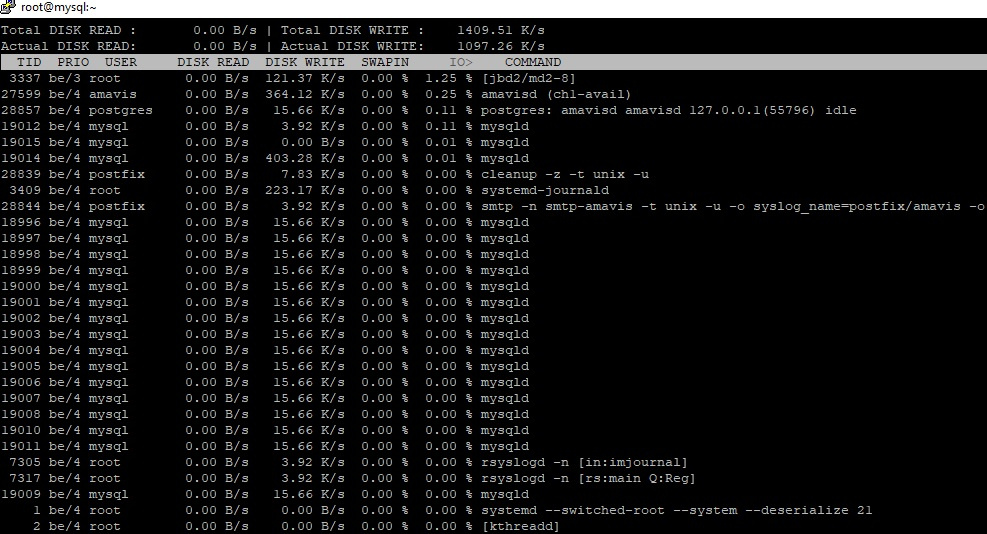
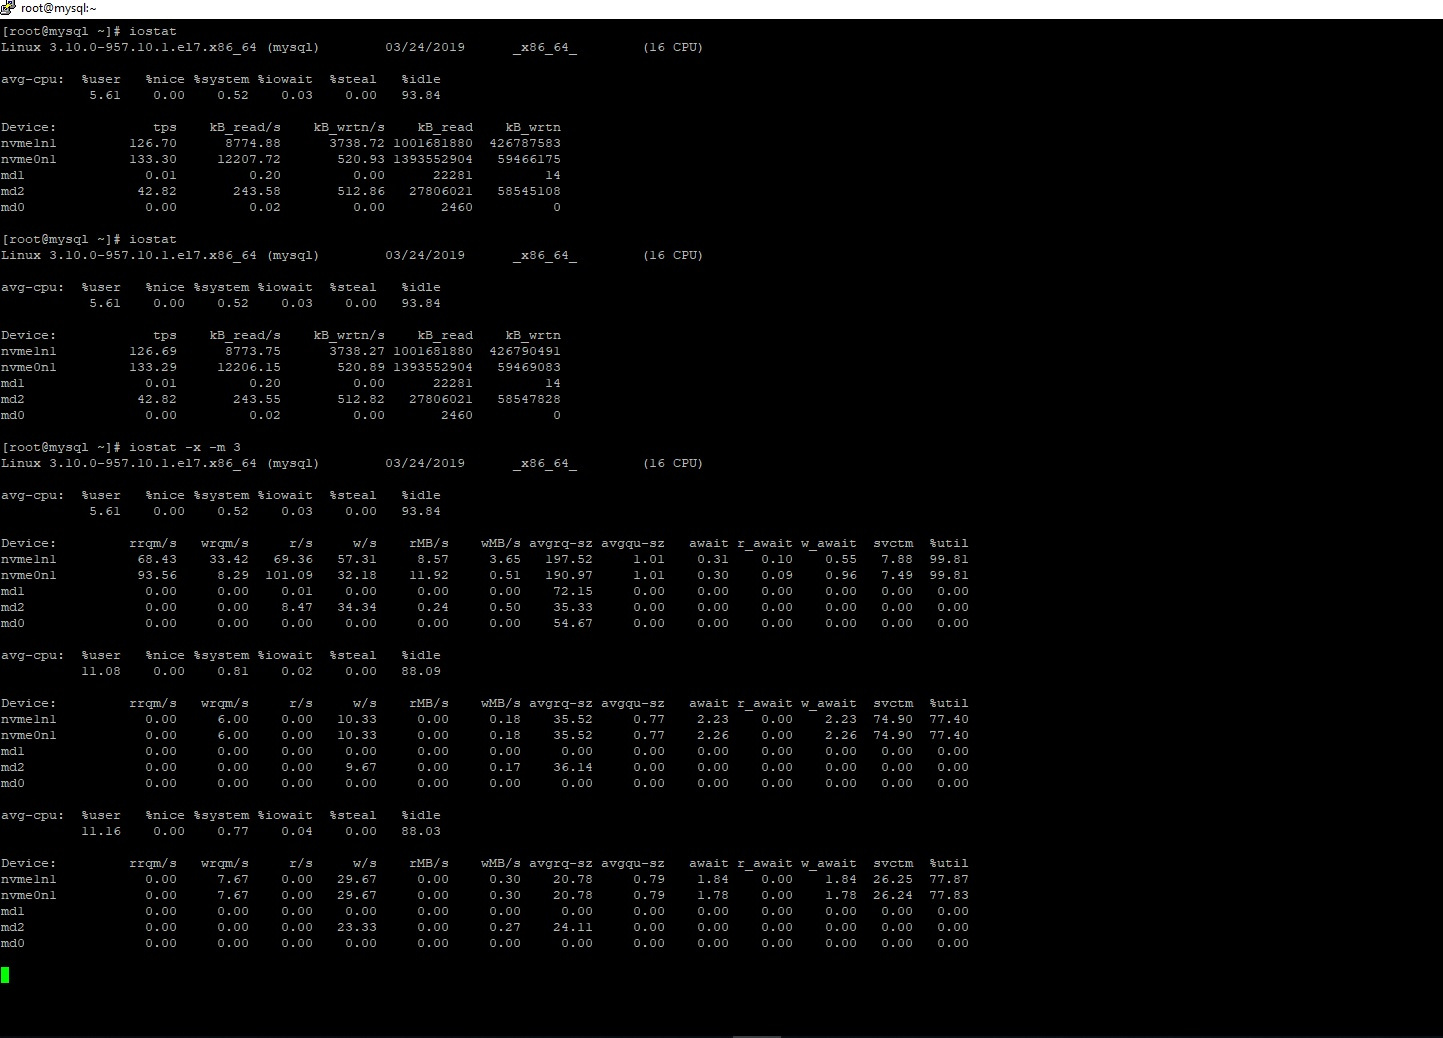
Answer the question
In order to leave comments, you need to log in
Stop twisting the values to incredible values without understanding what it generally affects.
read_buffer_size = 196M
read_rnd_buffer_size = 196M
sort_buffer_size = 196M
innodb_sort_buffer_size = 64M
max_heap_table_size = 1024M
tmp_table_size = 16384M
max_user_connections = 6000
max_connections = 18000
Didn't find what you were looking for?
Ask your questionAsk a Question
731 491 924 answers to any question