Answer the question
In order to leave comments, you need to log in
MySQL loads all cores of the processor. Glitch?
This picture illustrates the problem best of all 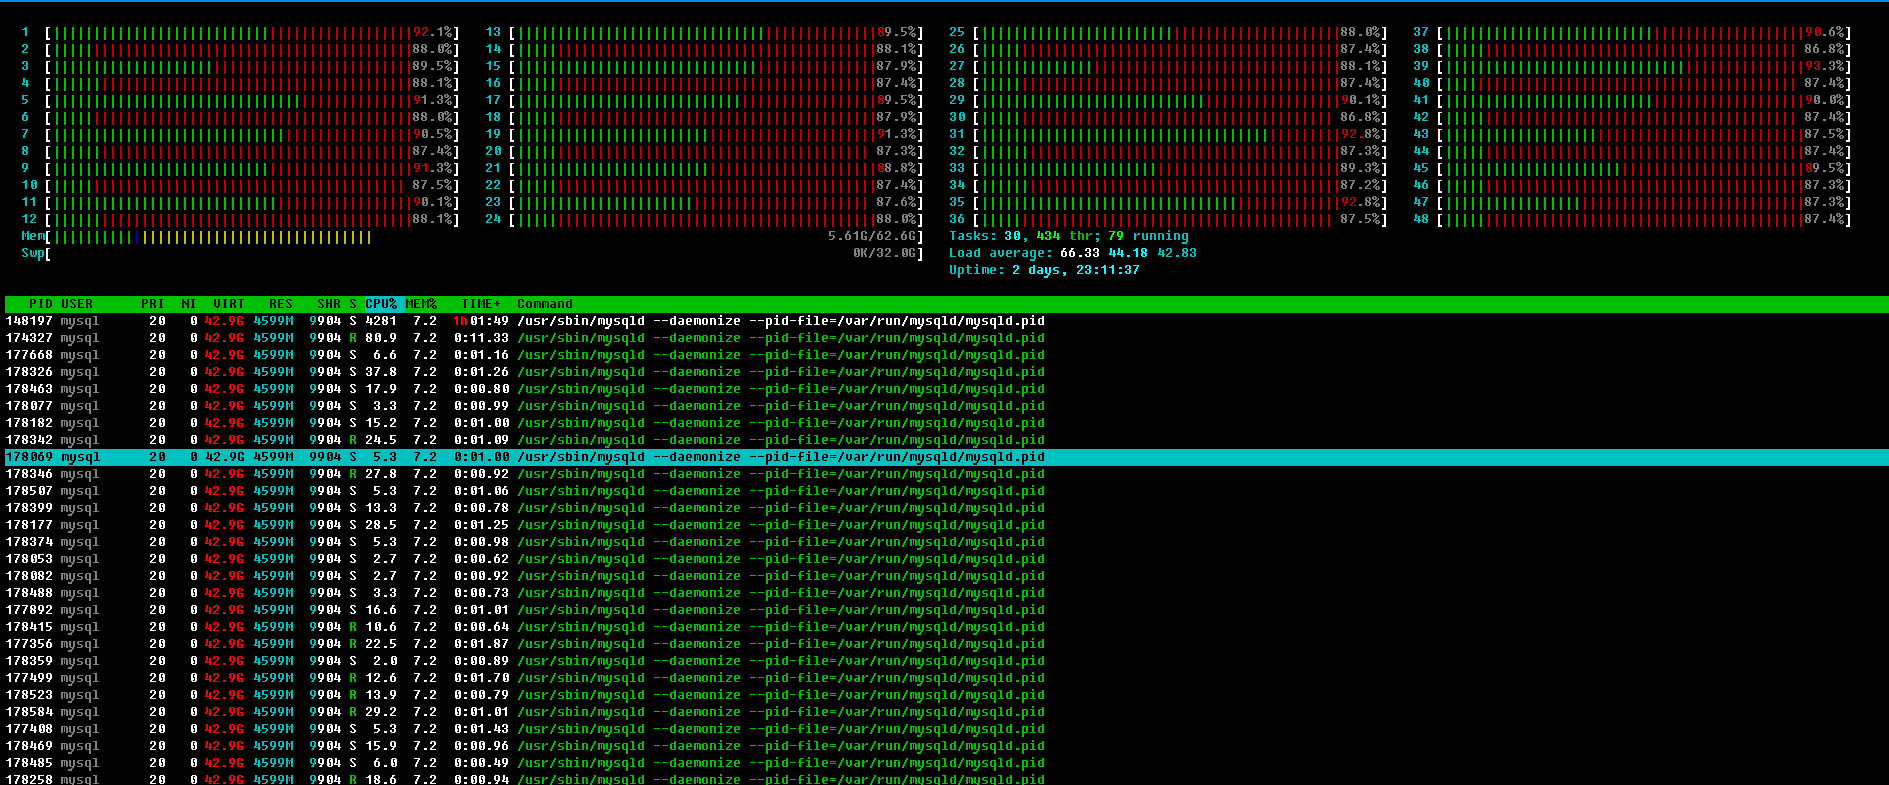
. If you describe it in words, it turns out like this. The server works as if nothing had happened. About half of the cores are loaded. And not 100%, but 50-70%. Then suddenly the load flies into space. At the same time, the base gets cancerous, the answers take a very long time. All this lasts 10-50 seconds, and then again a break for a minute.
And I can't figure out what is causing this problem. Because this is not the first time I've seen this picture. I came across it before, even 5 years ago. That is, the actual version of the kernel, distribution, or even muscle is most likely nothing to do with it.
Moreover, monitoring (htop) shows that the percentage is loaded with a system call. Those. this is either a huge number of some calls to the kernel, or intensive memory allocation-taking, or I/O.
But I don't know how to monitor the topmost kernel calls. Memory, again, according to monitoring, is not massively allocated or taken away (at least in gigabytes, so that it is noticeable).
iotop shows input/output not much different from that in the normal state.
Requests during a glitch are performed by the most common ones. Not to say that the selection / update proportion somehow changed, or special tables were requested. I thought maybe something on the crown is launched from periodic tasks. But I tried to stop them all for a while. The problem remains.
Speaking of server and system: 2 x Xeon E5-2680v3 @2.5GHz (24 real cores), 64GB DDR4. SSD enterprise level 960GB. Fast. Well, that is, the server is even nothing. OS Centos 7 (kernel 3.10), I use Percona 5.7. The base is on a separate section (however, the piano should not particularly play this). In addition to the muscle on the server, there is nothing at all.
Actually a week since they moved from the old server, which was exactly 2 times weaker and stopped pulling the load.
So on it, at first, I also saw the same picture periodically. But then I picked up such parameters in the muscle config that everything seemed to subside. But still, the server stopped pulling, and we moved to a new one ... and here again this problem.
And then it's time to move on to tell what I ALREADY did:
1) Restart the muscle - saves the situation for a minute
2) Restarting the server does not affect anything
3) Tuning parameters. Tried the default ones. Tried from an old server. Tried to raise to reasonable values. Tried to the unreasonable. I tried to tune according to the advice of the mysqltuner utility. Nothing helps.
Important note: the problem is observed only during rush hour. So all this clearly correlates with the load on the muscle server. The rest of the day is ok.
What else I want to say... I'm not a real welder. In sense not DBA. Just an ordinary Linux admin. I don't understand how mysql, innodb and so on work inside. Therefore, I ask for help. I couldn't figure it out myself.
Below I will attach a hat from mytop just in case:
MySQL on localhost (5.7.18-16)                                                              up 0+00:38:59 [00:32:19]
 Queries: 26.1M  qps: 11695 Slow:     0.0         Se/In/Up/De(%):    66/09/04/00
             qps now: 11493 Slow qps: 0.0  Threads:  180 (   5/   8) 66/09/04/00
Key Efficiency: 93.0% Bps in/out: 11.0M/89.7M Now in/out: 10.7M/90.5M[mysqld]
bind-address=xxxx
datadir=/var/lib/mysql
socket=/var/lib/mysql/mysql.sock
user=mysql
symbolic-links=1
innodb_buffer_pool_size=16384M #пробовал всякое. от 8 до 32гб. разницы нет
innodb_log_file_size=1024M # тоже всякое. вплоть до комментирования
innodb_flush_method = O_DIRECT
innodb_flush_log_at_trx_commit = 0
sql-mode=""
query_cache_size = 4096M # тоже менял от 0 до 4гб
join_buffer_size = 64M
thread_cache_size = 8
max_connections=8192
open_files_limit=8192
explicit_defaults_for_timestamp=1
max_allowed_packet=128M
log-error=/var/log/mysqld.log
log_error_verbosity=2
[mysqld_safe]
log-error=/var/log/mysqld.log
pid-file=/var/run/mysqld/mysqld.pid
open_files_limit=4096
innodb_buffer_pool_populate = yes
flush_caches = yes
numa_interleave = yesAnswer the question
In order to leave comments, you need to log in
Google the leap second error - one of its symptoms may be an abnormal loading of the processor.
Another option: see how NUMA is configured and how it functions. Might be worth enabling interleave in mysqld_safe settings (via numactl).
What about IO? What is the disk load? Look through iotop for example.
By parameters. In addition to the muscle on the server, is something spinning? If not, feel free to turn
innodb_buffer_pool_size up to about 70% of RAM.
innodb_log_file_size is the size of the innodb transaction log. The larger it is, the less often this file is recreated, and the less the load on the disk. But the longer the recovery in case of failure. 512mb should be enough.
innodb_flush_log_at_trx_commit = 0 Are you sure? Put at least 2 - in terms of performance, the same as the same, but safer. Or better yet 1. Slowly, but reliably.
query_cache_size = 4096M Where so many? Remember that with every INSERT\UPDATE this cache is overwritten. Put 100mb to start.
So citizens. I'm fine. The problem is gone.
It looks like it was in massive memory operations that the muscle / core was forced to carry out every few tens of seconds. And the reason for this was incorrect settings of buffers and caches in the config.
And most likely the most influential of them was query_cache_size.
The second thing (or rather the first) to check and make sure you don't have a problem with it is the leap second bug. Google on the Internet, look and check.
Thanks to everyone who participated in the discussion.
It seems that the situation will have to be debugged at the level of request modification from the application. As mentioned above, at the time of debugging, you should enable and analyze the slow query log. Somewhere to add indexes, somewhere to replace reading from a regular table with reading from a temporary table. Right there, SQL itself regulates the tool of all times and peoples - EXPLAIN.
A separate point is to pay attention to blocking. I often encountered a situation where a lot of read requests prevent write requests from being executed (or vice versa, an overload of write requests blocks reading), which instantly overwhelms the queue under load - and the main processor time is spent managing this queue. Specifically, from my experience (I worked as a technician in a hosting company for a little over a year), most often the problem manifested itself with sites based on Wordpress. Moreover, the Wordpress engine itself is well optimized. The problem is the endless number of plugins from the authors of the middle hand. Especially, plugins related to the collection / calculation of statistics. When generating one page, dozens of conflicting read and write requests are used. used to due to locks, two simultaneously working (competing) php instances send requests to the database blocking each other's work with such intensity that adequate work is possible only by limiting their number to one php instance. And no move to a more powerful or cloud server will help. Solving logical errors by increasing capacity is inefficient and can be very expensive. - Therefore, any increase in the capacity of iron is a temporary solution, and can delay debugging work for a maximum of several days. In designing applications (both web / rest and standalone), you need to understand what each action does - either it writes to the database or reads from the database. If each action requires many reads and writes to the same tables, this will inevitably lead to locking problems. that adequate work is possible only by limiting their number to a single php instance. And no moving to a more powerful or cloud server will help. Solving logical errors by increasing capacity is inefficient and can be very expensive. - Therefore, any increase in the capacity of iron is a temporary solution, and can delay debugging work for a maximum of several days. In designing applications (both web / rest and standalone), you need to understand what each action does - either it writes to the database or reads from the database. If each action requires many reads and writes to the same tables, this will inevitably lead to locking problems. that adequate work is possible only by limiting their number to a single php instance. And no moving to a more powerful or cloud server will help. Solving logical errors by increasing capacity is inefficient and can be very expensive. - Therefore, any increase in the capacity of iron is a temporary solution, and can delay debugging work for a maximum of several days. In designing applications (both web / rest and standalone), you need to understand what each action does - either it writes to the database or reads from the database. If each action requires many reads and writes to the same tables, this will inevitably lead to locking problems. - Therefore, any increase in the capacity of iron is a temporary solution, and can delay debugging work for a maximum of several days. In designing applications (both web / rest and standalone), you need to understand what each action does - either it writes to the database or reads from the database. If each action requires many reads and writes to the same tables, this will inevitably lead to locking problems. - Therefore, any increase in the capacity of iron is a temporary solution, and can delay debugging work for a maximum of several days. In designing applications (both web / rest and standalone), you need to understand what each action does - either it writes to the database or reads from the database. If each action requires many reads and writes to the same tables, this will inevitably lead to locking problems.
It is useless to use tools for analyzing io events to solve mysql problems - mysql controls the use of io quite well without bringing the kernel to overloads. But, again, it provides a lot of settings for non-system restrictions that can be set inefficiently and the problem can be solved by adjusting them.
And another thought for the sake of food for thought - in most situations, tables MyISAMwork many times faster InnoDB.
Slow: 0 out of 26 queries? Are all the requests so good or is the slow log disabled?
Didn't find what you were looking for?
Ask your questionAsk a Question
731 491 924 answers to any question